Bitcoin’s Next Bull Run: Will It Smash Through $115K or Rocket to $223K?

Bitcoin's gearing up for another epic showdown with resistance levels—but this time, the stakes are higher than a Wall Street bonus round.
The $115K vs. $223K debate
Traders are split between two cosmic price targets as BTC flirts with all-time highs. Technical analysts see Fibonacci extensions painting both scenarios, while permabulls whisper 'hyperbitcoinization' over triple-digit price tags.
Institutional FOMO meets retail frenzy
BlackRock's ETF inflows could fuel the first target, but true escape velocity might require that sweet spot where boomers panic-buy and crypto Twitter loses its collective mind. (Pro tip: When CNBC starts running 'how to buy crypto' segments, we're probably halfway there.)
The cynical kicker
Meanwhile, traditional finance still can't decide if Bitcoin's digital gold or a speculative asset—but they'll happily charge 2% management fees either way.
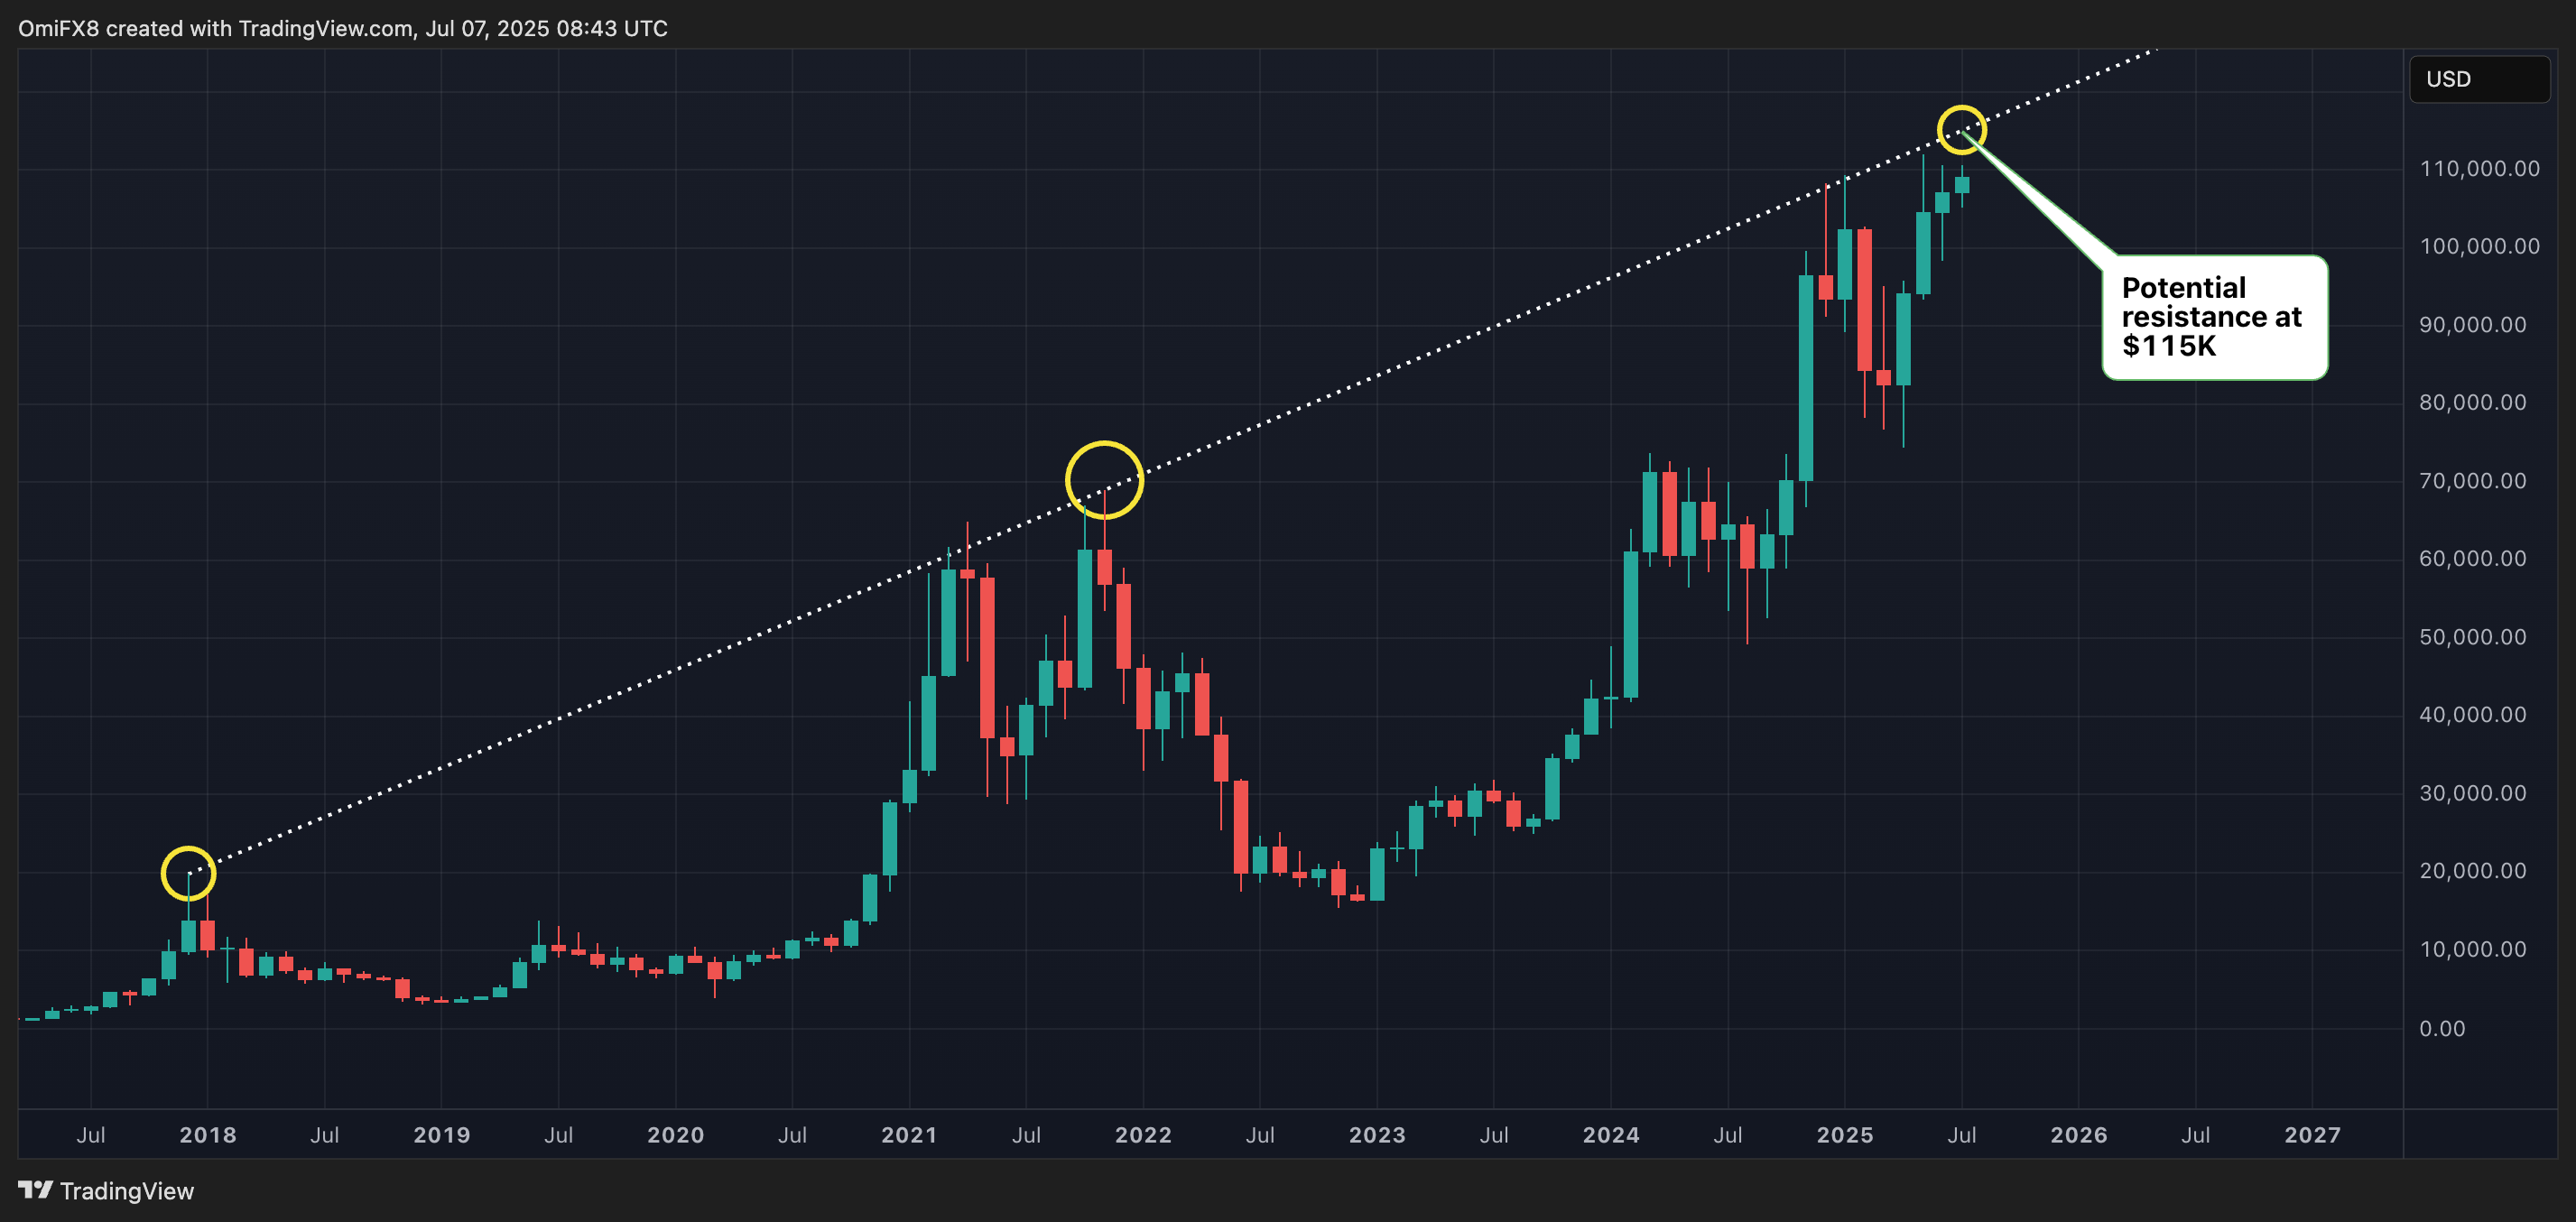
The same trendline capped upside in December and January, paving the way for a correction that saw prices drop to a low of $75,000 in April.
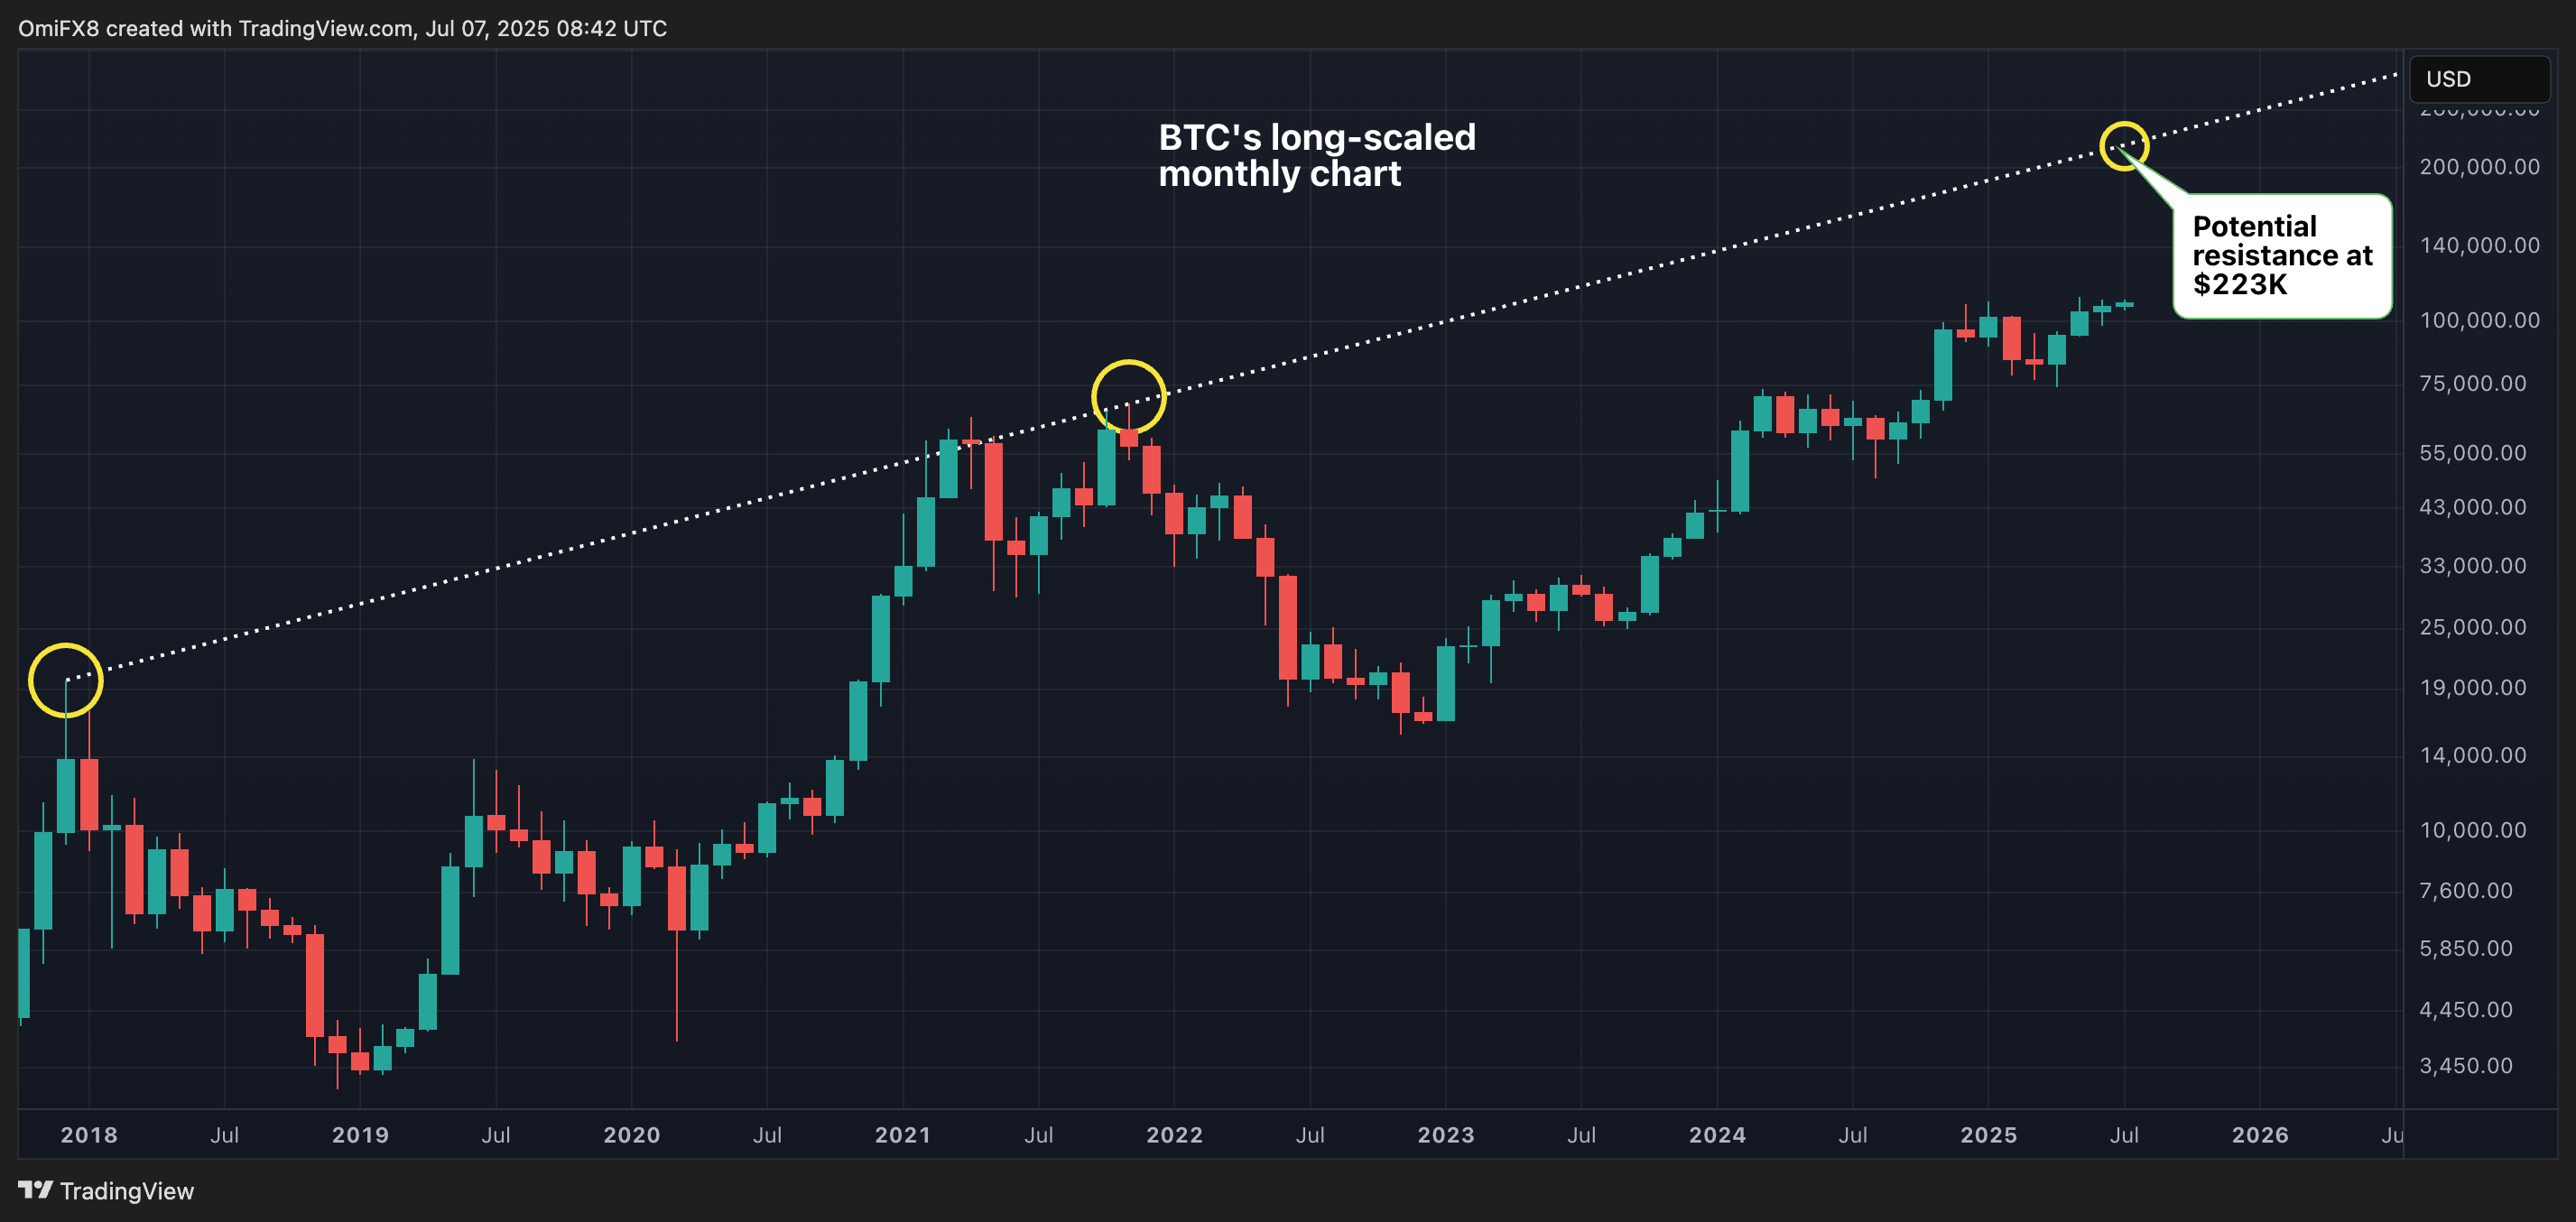
Log-scaled resistance at $220K
That said, the above chart is a linear-scaled or arithmetic-scaled monthly chart. It shows the absolute price changes, a feature that makes it suitable for analyzing short-term trends.
The potential resistance price, however, may be less reliable than that derived from the long-scaled chart, which compresses significant percentage moves, making trendlines and resistance levels more precise and more meaningful.
Connecting the 2017 and 2021 highs on the log-scaled monthly chart aligns the resistance at approximately $223,000, rather than $115,000. The log-scaled trendline resistance is likely more consistent with the exponential growth pattern of bitcoin's past bull markets.