Shiba Inu Paints Bullish Inverse H&S Pattern as BONK Rides ETF Hype—1M Holders Locked In

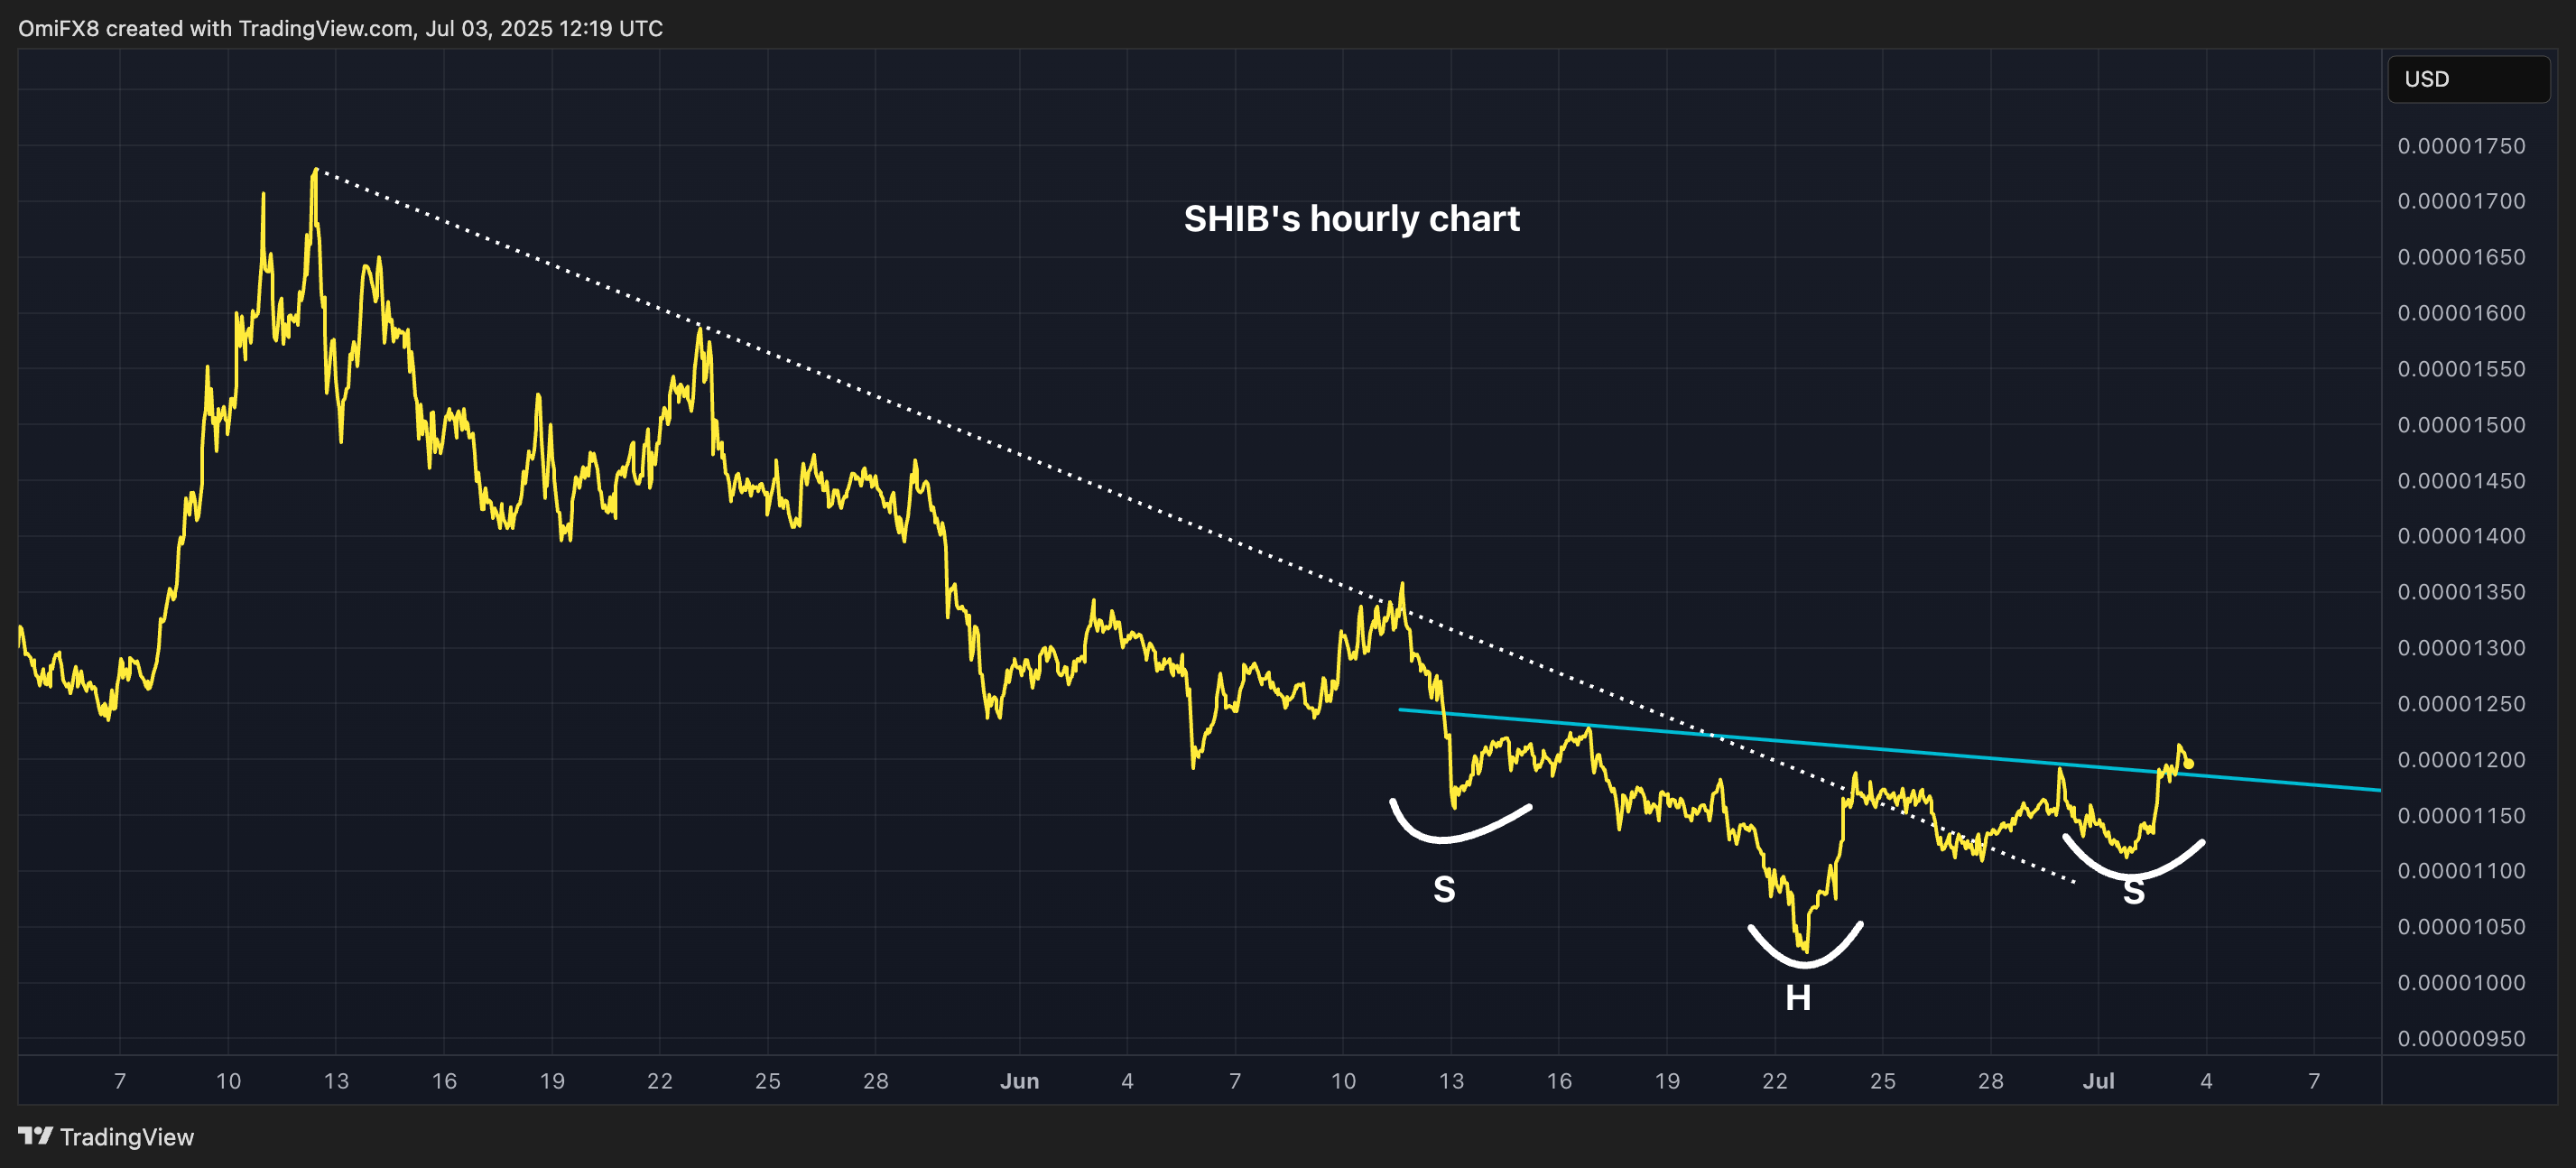
Shiba Inu's chart flashes a textbook inverse head-and-shoulders—the kind that makes traders whisper 'bull run' into their lattes. Meanwhile, BONK's 30% surge rides purely on ETF speculation fumes. Because nothing pumps a memecoin like imaginary institutional approval.
1 million holders now cling to SHIB like a life raft. Whether that's diamond-handed conviction or sunk-cost fallacy depends which side of the red candle you're on.
Pro tip: When the 'ETF narrative' hits meme coins, check your wallet—and your sanity. Wall Street's not coming for your dog tokens, no matter how many inverse patterns appear.
Key AI insights
- SHIB demonstrated remarkable strength during the 24 hours from July 2, 12:00 to July 3, 11:00, climbing from $0.00001136 to $0.00001200, representing a 5.65% gain with a price range of $0.00000081.
- The token experienced a significant volume spike at 16:00 on July 2 (1.68B), establishing a high-volume support level at $0.00001162.
- The 24-hour volume profile confirms strong buyer interest, particularly during the European trading session.
- During the 60 minutes from 3 July 10:09 to 11:08, SHIB experienced notable volatility, initially trading at $0.00001204 before declining to $0.00001199, representing a 0.41% decrease.
- A significant volume spike occurred at 10:18 (15.01B), followed by an even larger spike at 11:04 (20.94B), coinciding with a price recovery from the session low of $0.00001195 at 10:50.
- The 5-hour period between 05:00 and 10:00 on July 3 saw sustained trading above $0.0000120, forming a new resistance zone.
BONK surges
BONK, a memecoin built on the Solana blockchain in late 2022, has surged 23% to $0.00001665 in the past 24 hours, becoming the best-performing top 100 cryptocurrency by market value.
According to CoinDesk's AI, the rally featured three distinct waves, with the most aggressive buying occurring between 23:00 and 01:00, when volume peaked at nearly 3 trillion units, establishing a high-volume support zone around $0.0000161.
The cryptocurrency also approached a one-million holder milestone. These bullish developments follow reports that Tuttle Capital’s proposed 2x Long BONK ETF has taken a procedural step forward.
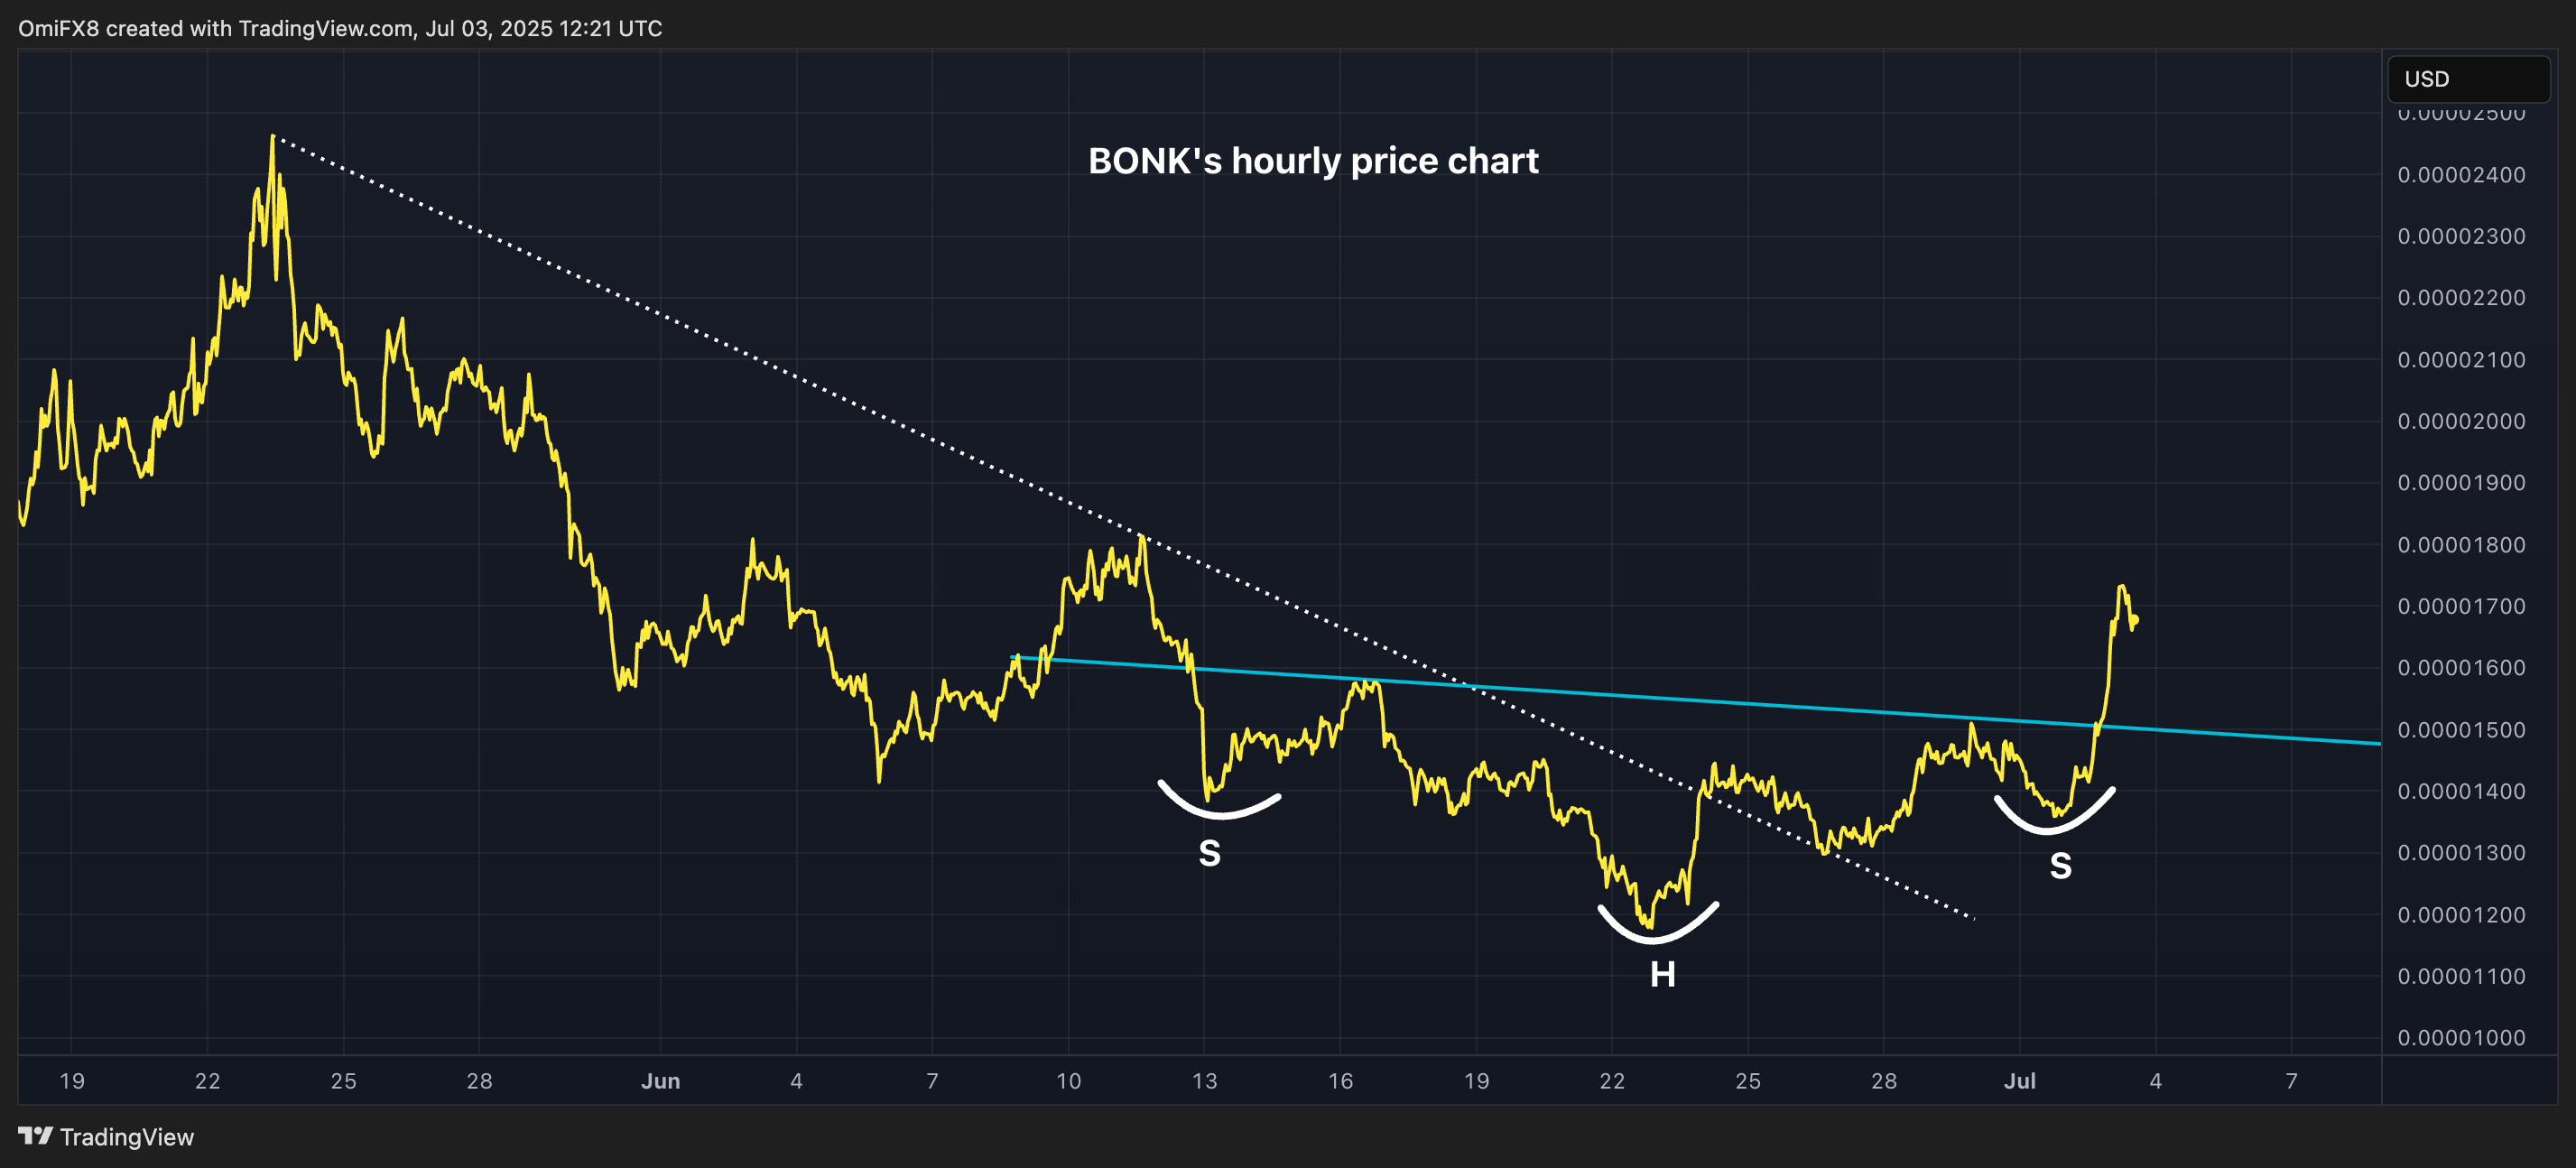
Speaking of technical analysis, BONK's hourly price chart displays a SHIB-like inverse head-and-shoulders bullish reversal pattern.
Key AI insights
- BONK-USD demonstrated remarkable strength over the 24 hours from 2 July 12:00 to 3 July 11:00, surging from $0.0000142 to $0.0000167, representing a 17% gain.
- A significant price range of $0.00000345 (24%) was observed, with strong volume-supported resistance at the $0.0000174 level during the 5:00 hour on July 3rd.
- During the 60 minutes from July 3, 10:34 to 11:33, BONK-USD experienced significant volatility, declining 1.35% from $0.00001689 to $0.00001667.
- A notable sell-off occurred at 10:42 when the price dropped 7.6% amid peak volume of 95.9 billion units.
