Bitcoin’s Bull Cross Triggers Market Frenzy—Is This the Start of a Mega Rally?

Bitcoin just flashed its most bullish technical signal in months—and traders are piling in. The ’golden cross’ formation—where the 50-day moving average surges above the 200-day—has historically preceded major uptrends.
Key indicators screaming buy:
- RSI holding steady at 65 (no overbought danger yet)
- Trading volume spiking 40% above monthly average
- Institutional inflows hitting $1.2B this week alone
Of course, Wall Street ’experts’ who called Bitcoin dead at $16K are suddenly revising their price targets. Funny how that works. The real question: Will this rally have legs, or is it just another pump before the Fed ruins the party? One thing’s certain—when Bitcoin gets this technical confirmation, even the suits pay attention.
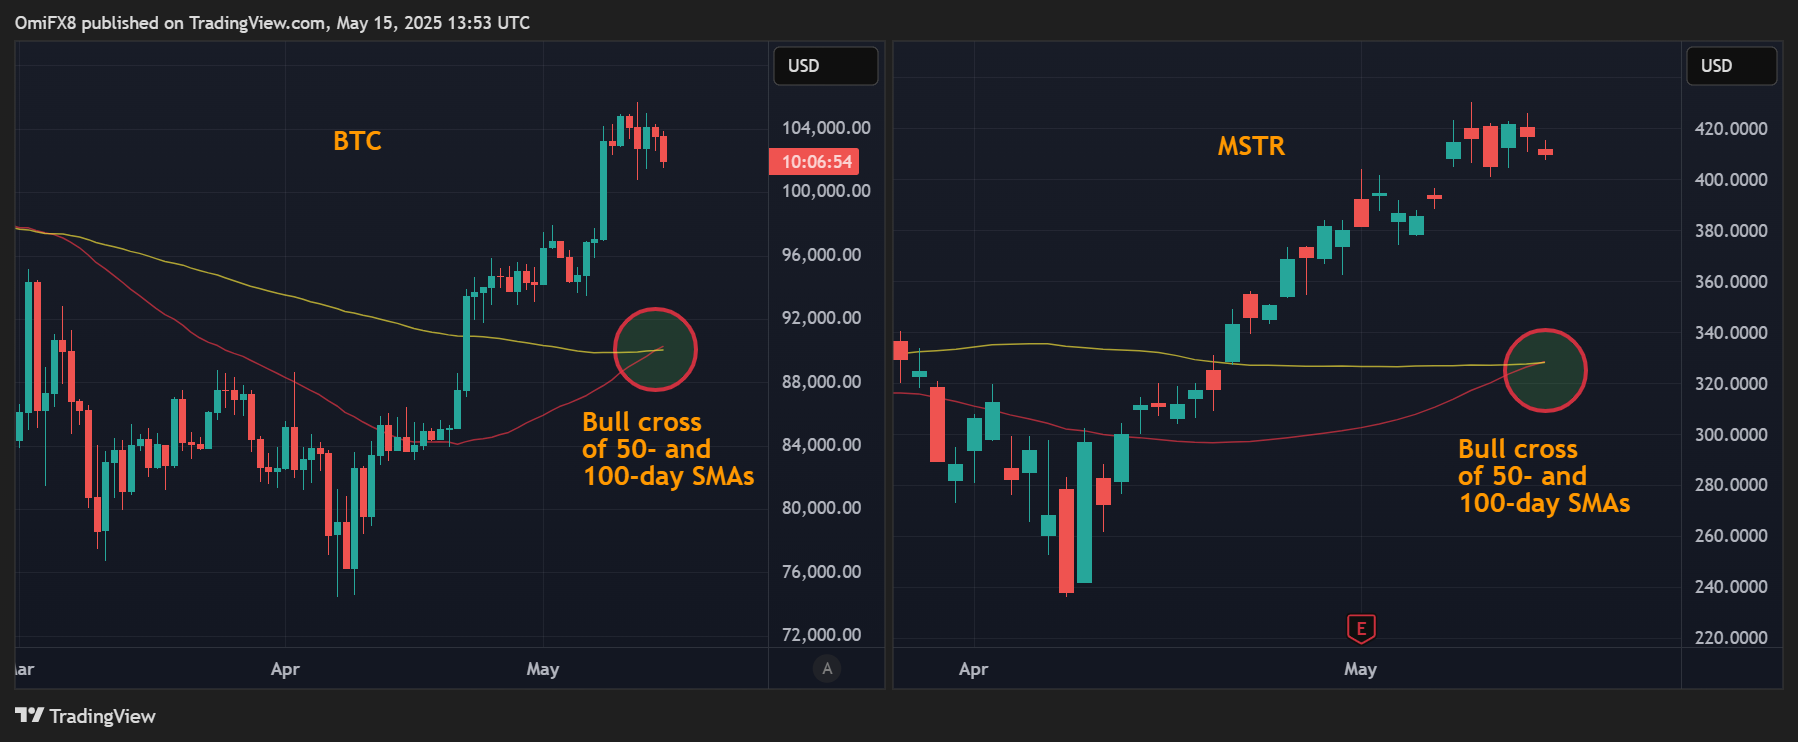
BTC’s bull cross is consistent with other indicators like the MACD, suggesting the path of least resistance is on the higher side.
That said, an interim drop below $100,000 cannot be ruled out, as on-chain data show influential market participants have turned cautious.
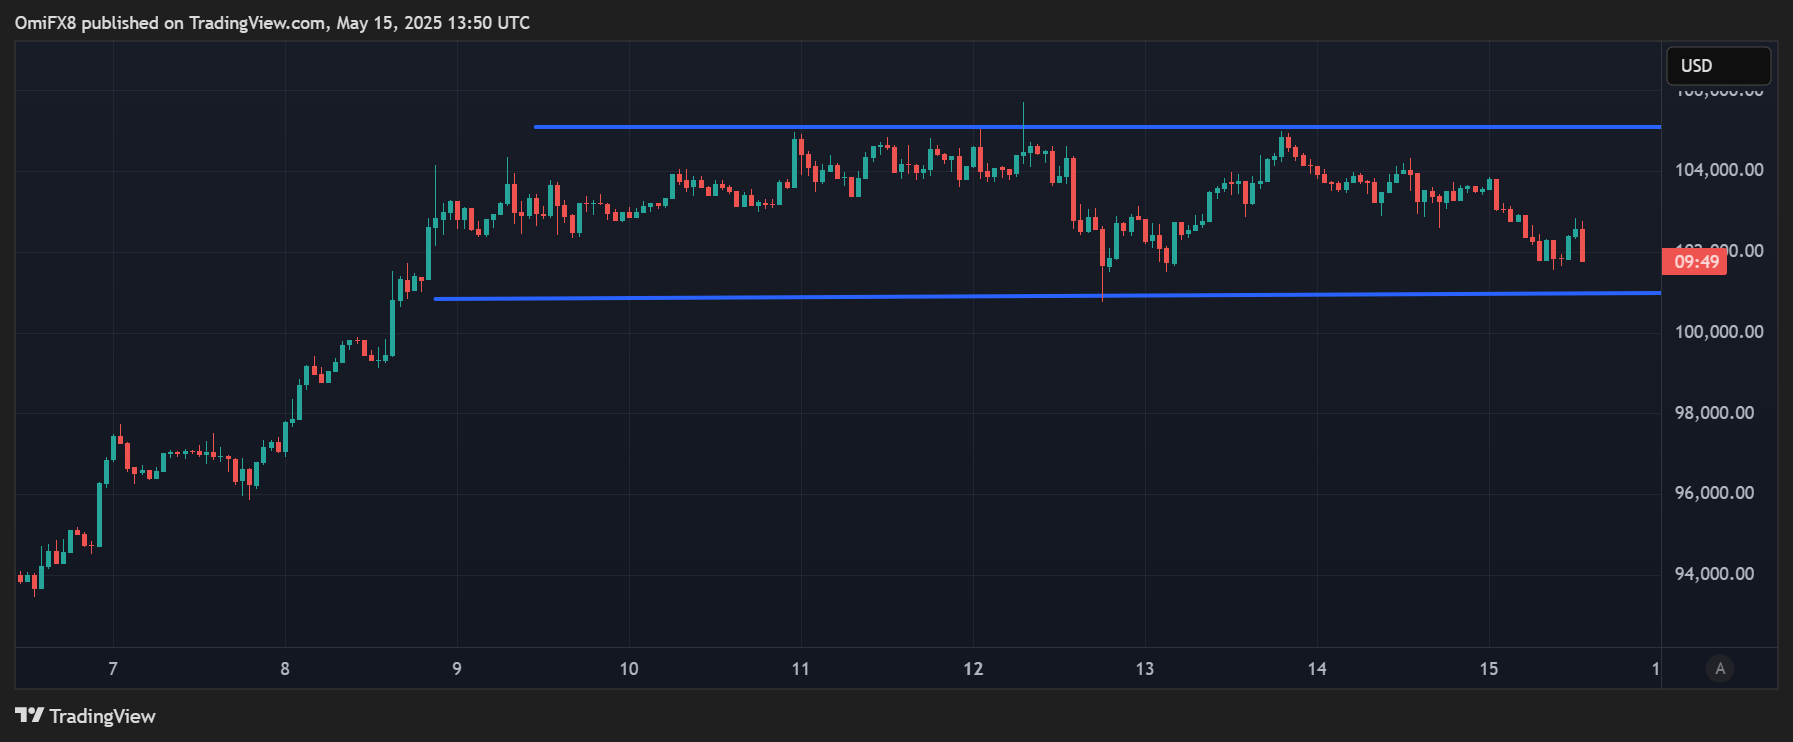
The chart shows BTC’s price rally has stalled in the $101,000-$107,000 range. A downside break could trigger more profit-taking, potentially deepening the bull market pullback to support at $98,000.
