Bitcoin Defies Gravity as MOVE Collapses - Dollar & Bonds Flash Red Alert for Risk Assets

While traditional markets tremble, Bitcoin charts its own course upward as the MOVE index implodes. The dollar strengthens and bond yields scream caution - but crypto marches to its own beat.
The Great Decoupling
Traditional risk assets face headwinds as Treasury volatility spikes and the dollar flexes its muscles. Yet Bitcoin continues its relentless climb, proving once again that crypto doesn't read the same playbook as stocks and bonds.
Safe Haven or Risk Asset? Yes.
Bitcoin's simultaneous defiance of both risk-off and risk-on narratives baffles traditional portfolio managers. While they scramble to rebalance their 60/40 allocations, crypto investors simply HODL through the noise.
Wall Street's favorite volatility gauge crumbles just as Bitcoin demonstrates its resilience. Another day, another reminder that sometimes the safest bet is the one that doesn't play by traditional rules - though good luck convincing your financial advisor of that.
What next?
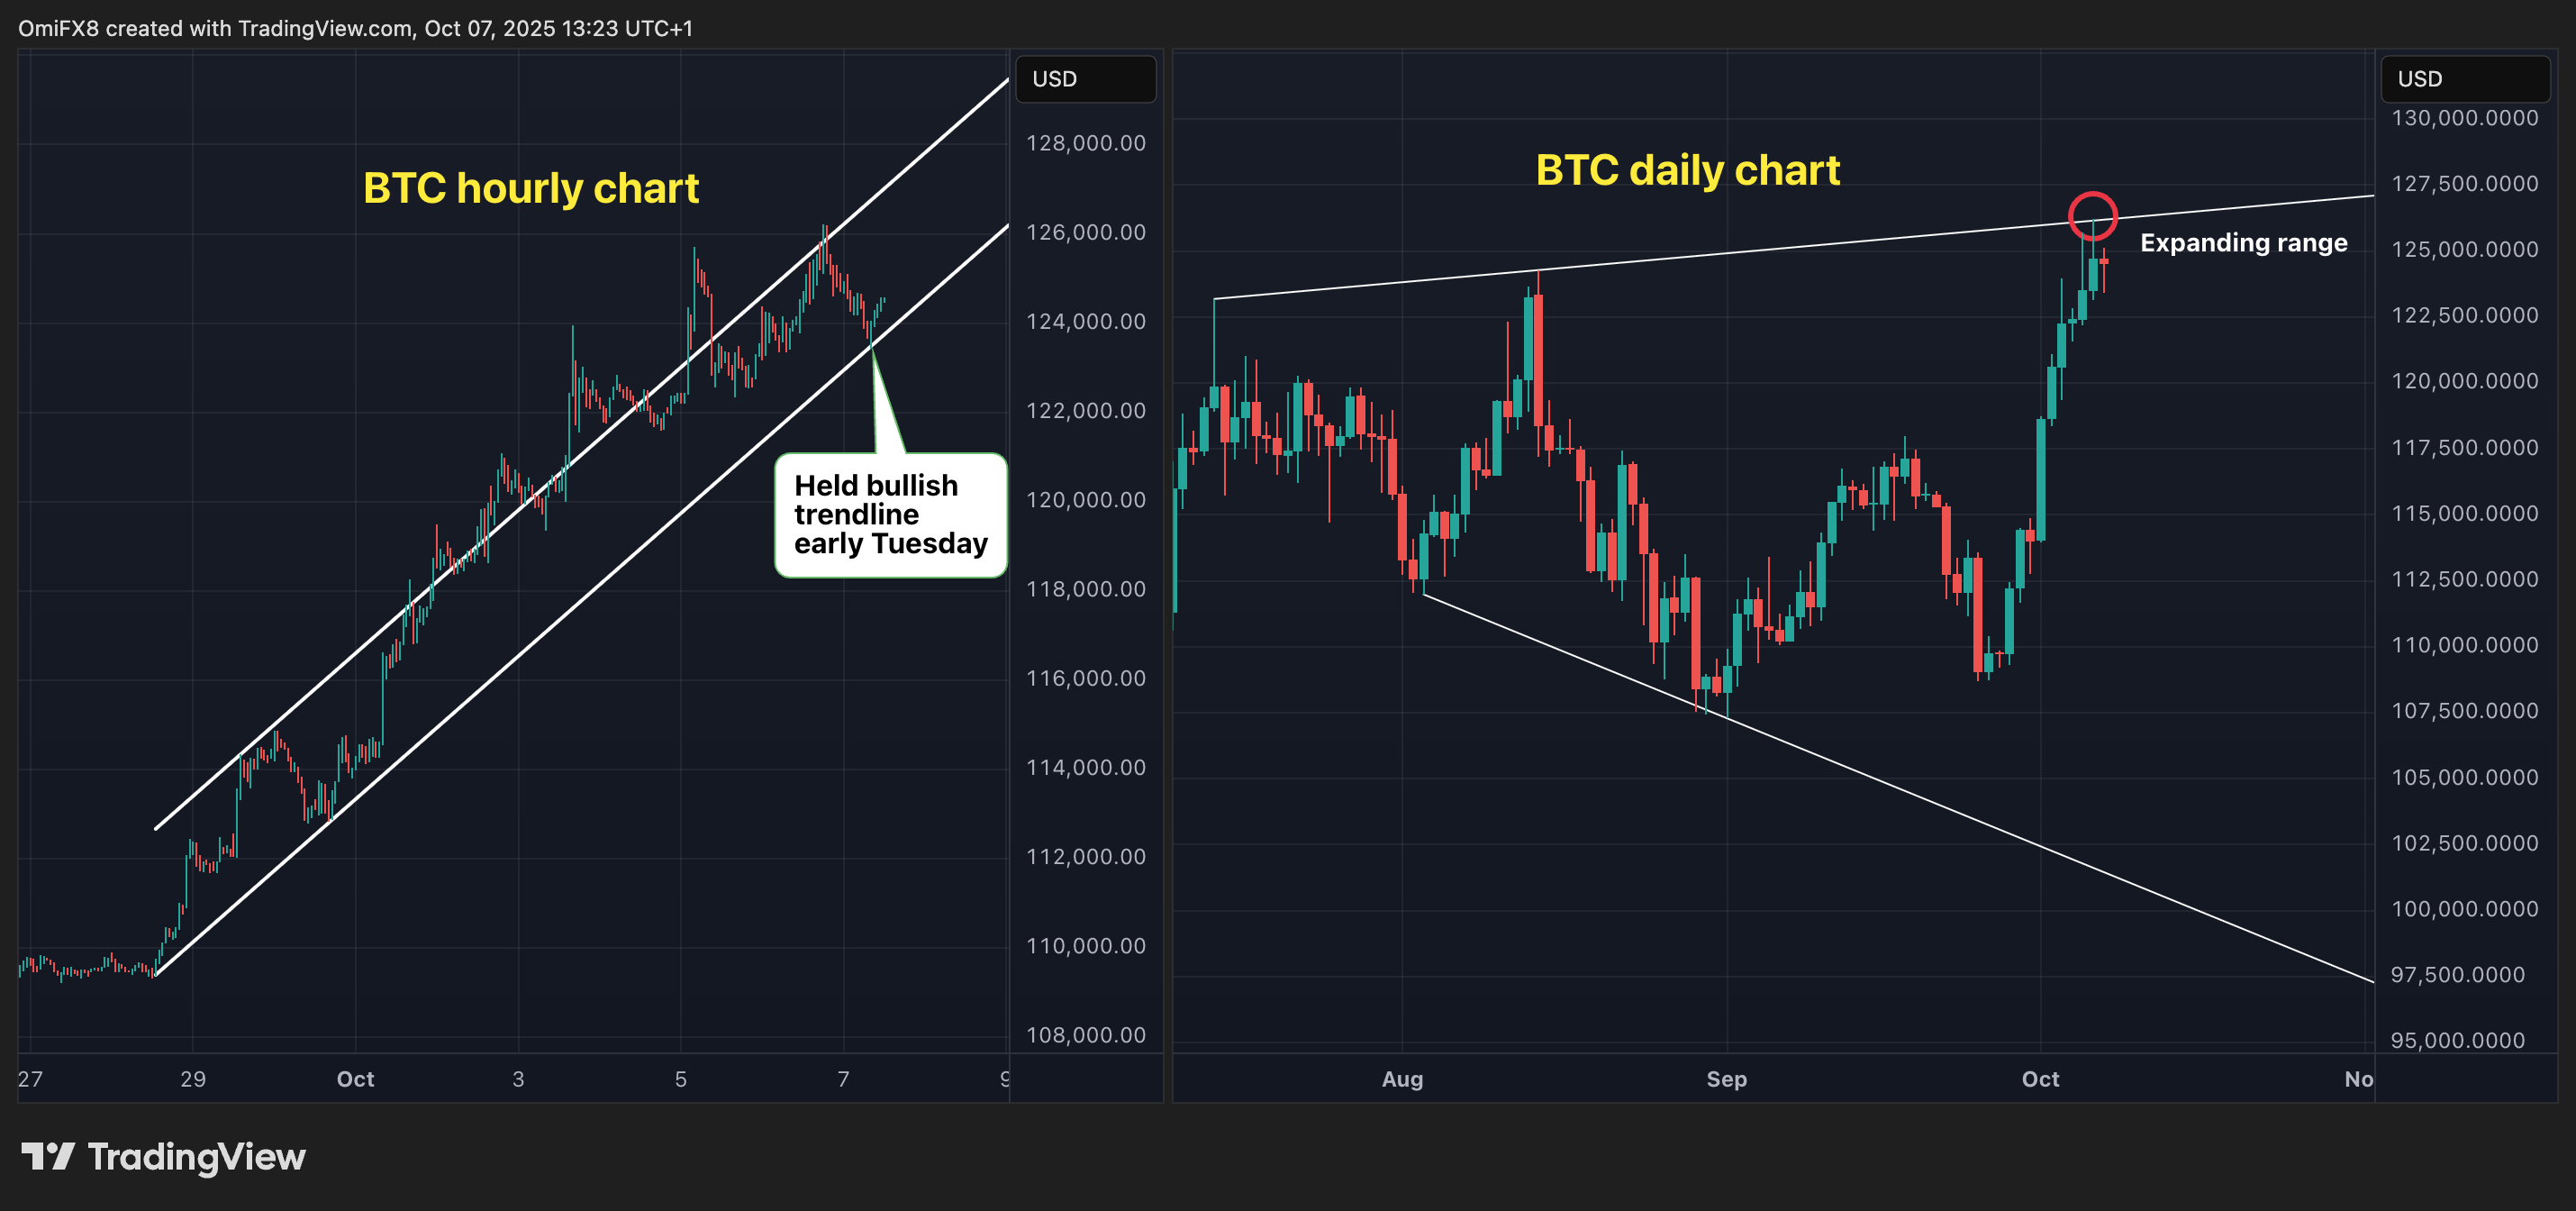
A clean breakout above the expanding triangle’s upper boundary on the daily chart could clear the path toward the $135,000 to $140,000 range. The upper boundary acted as resistance on Monday.
On the other hand, if BTC falls below the hourly chart's ascending trendline, we could see a corrective phase, with the first support level around $118,000.
What do traditional markets say?
Looking beyond BTC, traditional markets paint a picture where both bullish and corrective scenarios appear possible.
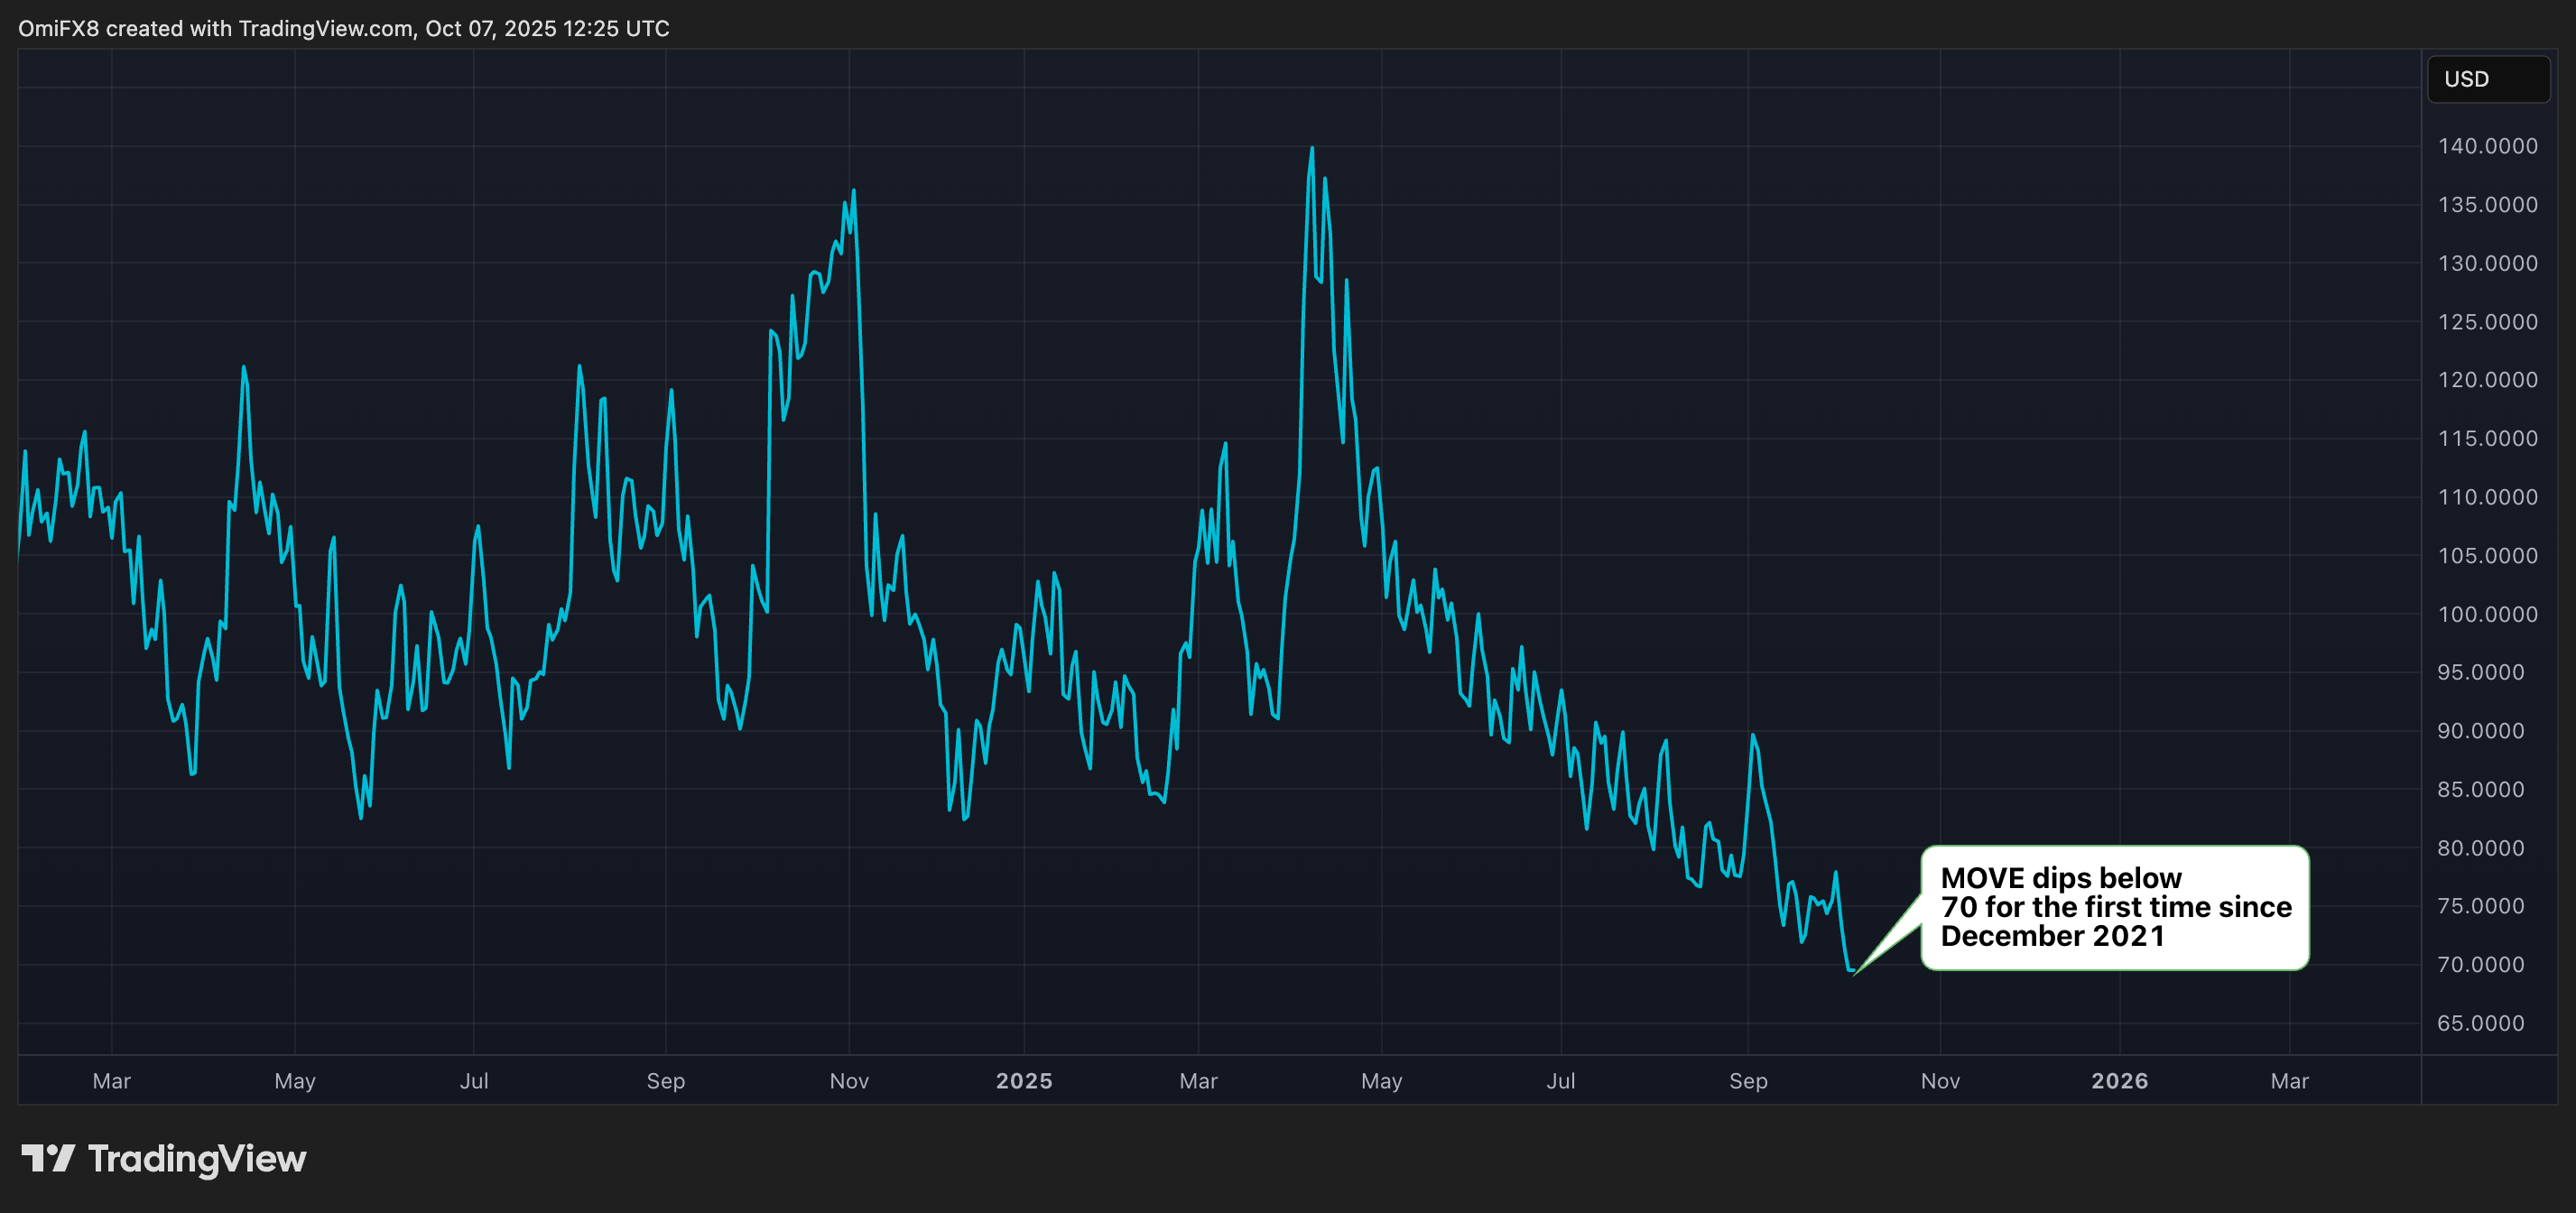
Bulls can take comfort from the MOVE index, which measures expected volatility in Treasury notes, continues to fall. The index dipped below 70 on Monday, its lowest since December 2021, signaling easier financial conditions for risk assets.
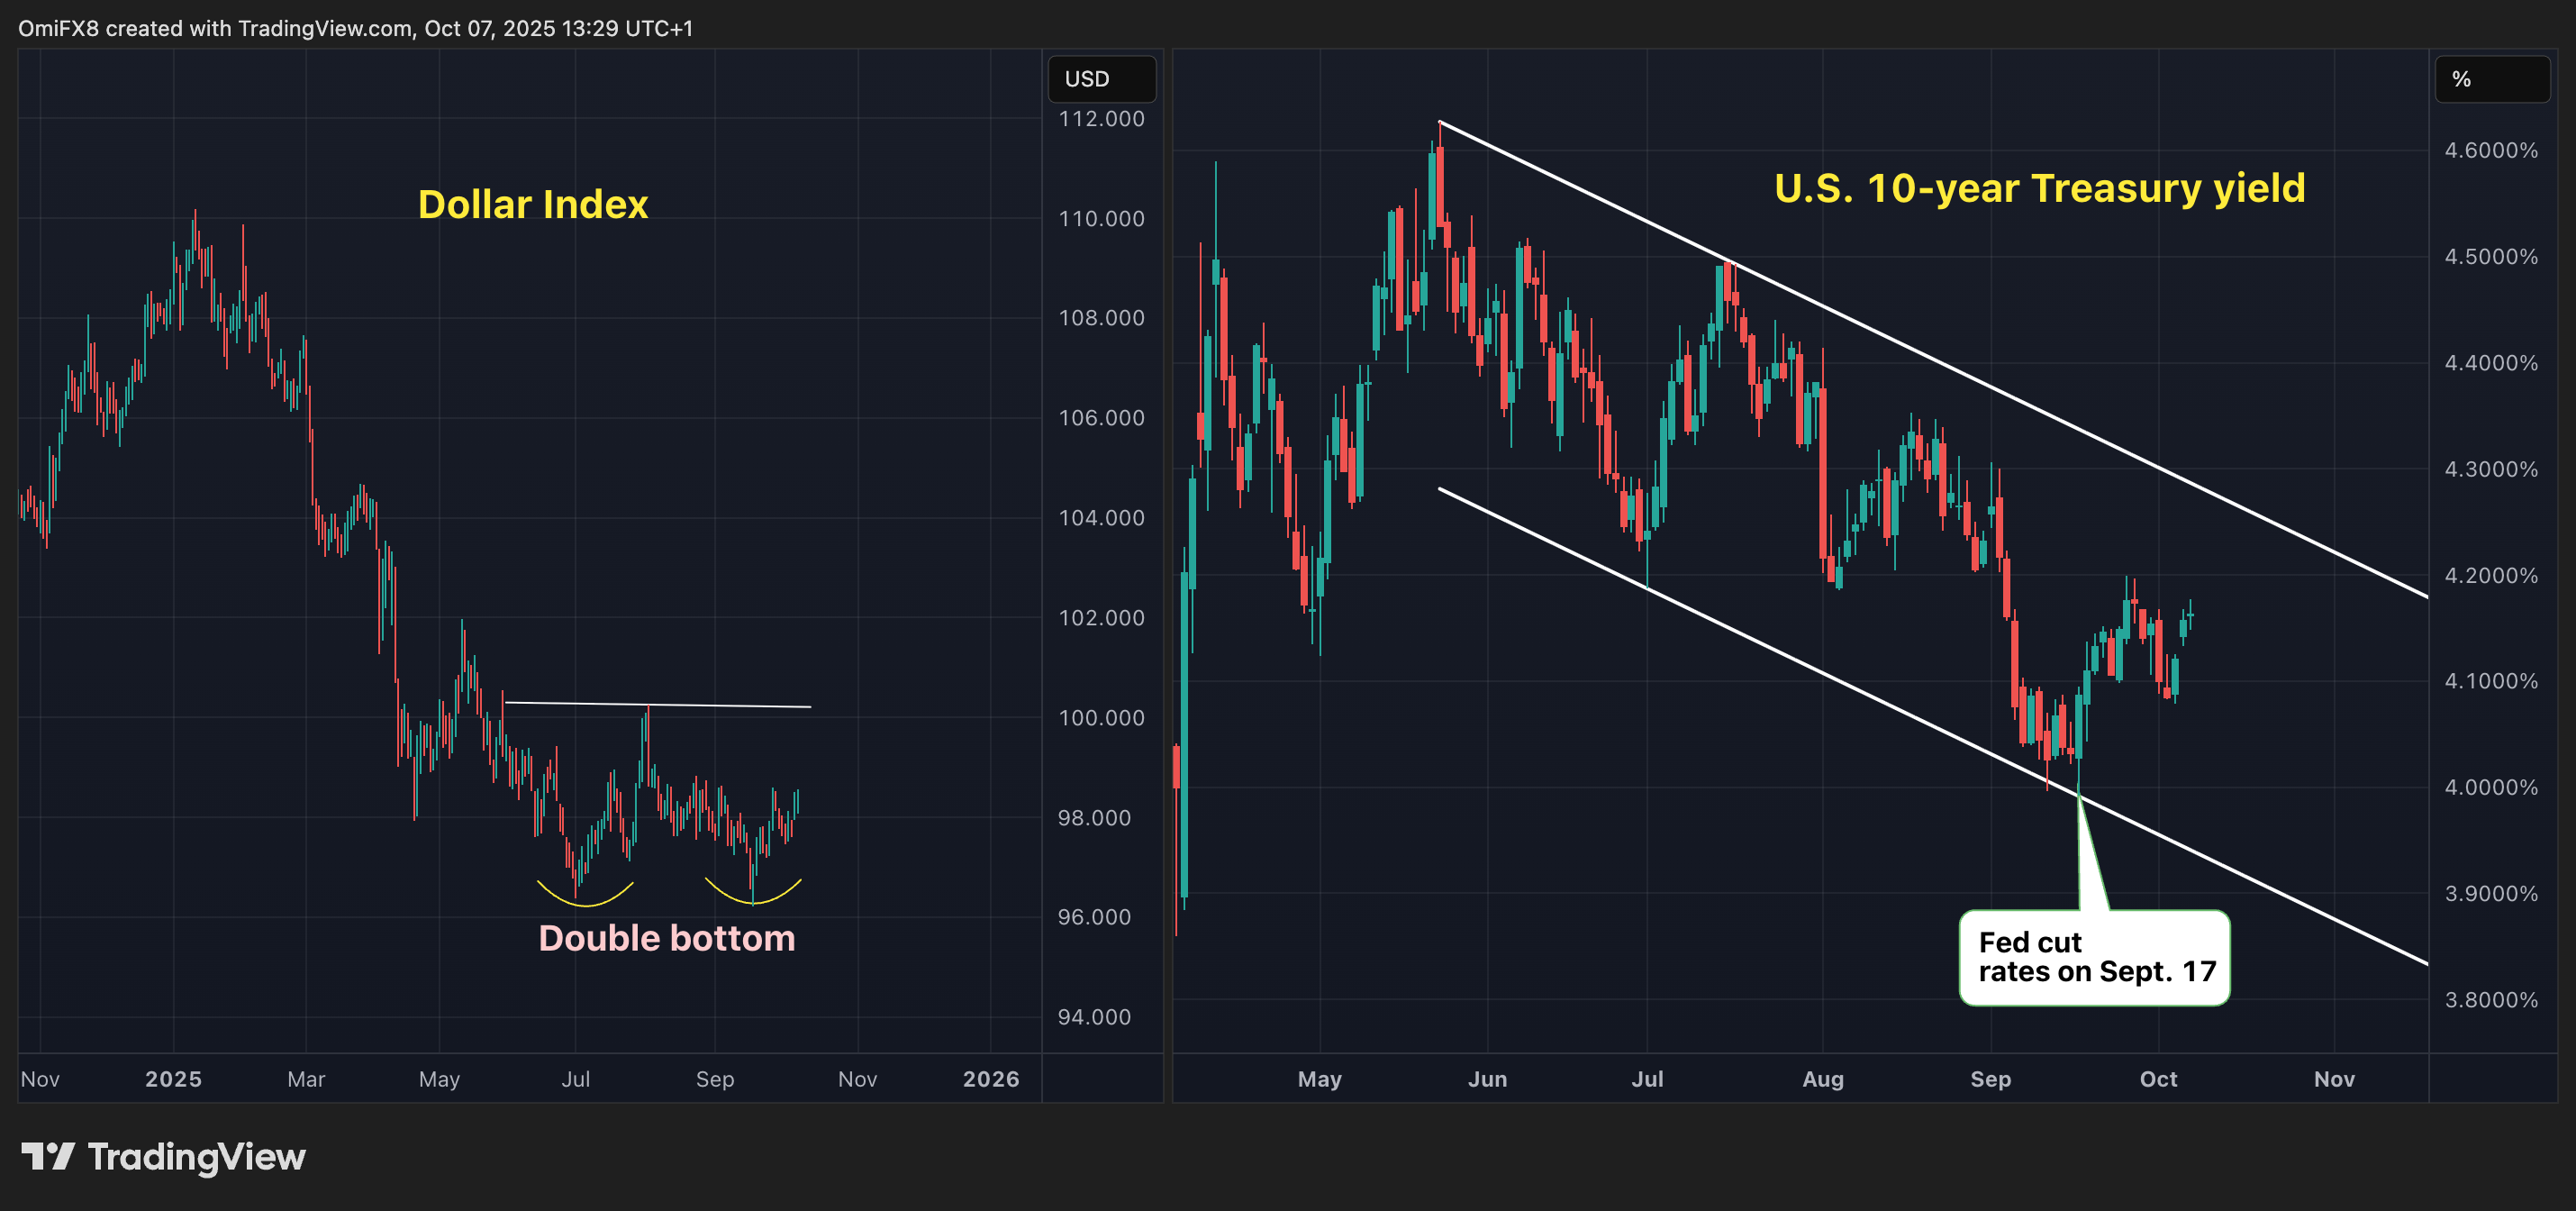
However, the dollar index (DXY) and Treasury yields remain resilient despite the September rate cut and expectations of more easing ahead.
The DXY is flirting with a bullish double bottom pattern, while the 10-year Treasury yield has risen 16 basis points to 4.16% since the Fed cut rates by 25 basis points on Sept. 17. In other words, the yield has at least partially undone the rate cut.
Adding to the mix, Goldman Sachs warned that Japan’s bond market shocks, driven by the new Prime Minister’s bias for Abenomics, could spill over into U.S. Treasuries and other major bond markets, injecting more uncertainty into the picture.
Traders should keep a close eye on these indicators, as continued strength in the dollar and yields could disrupt crypto’s rally.
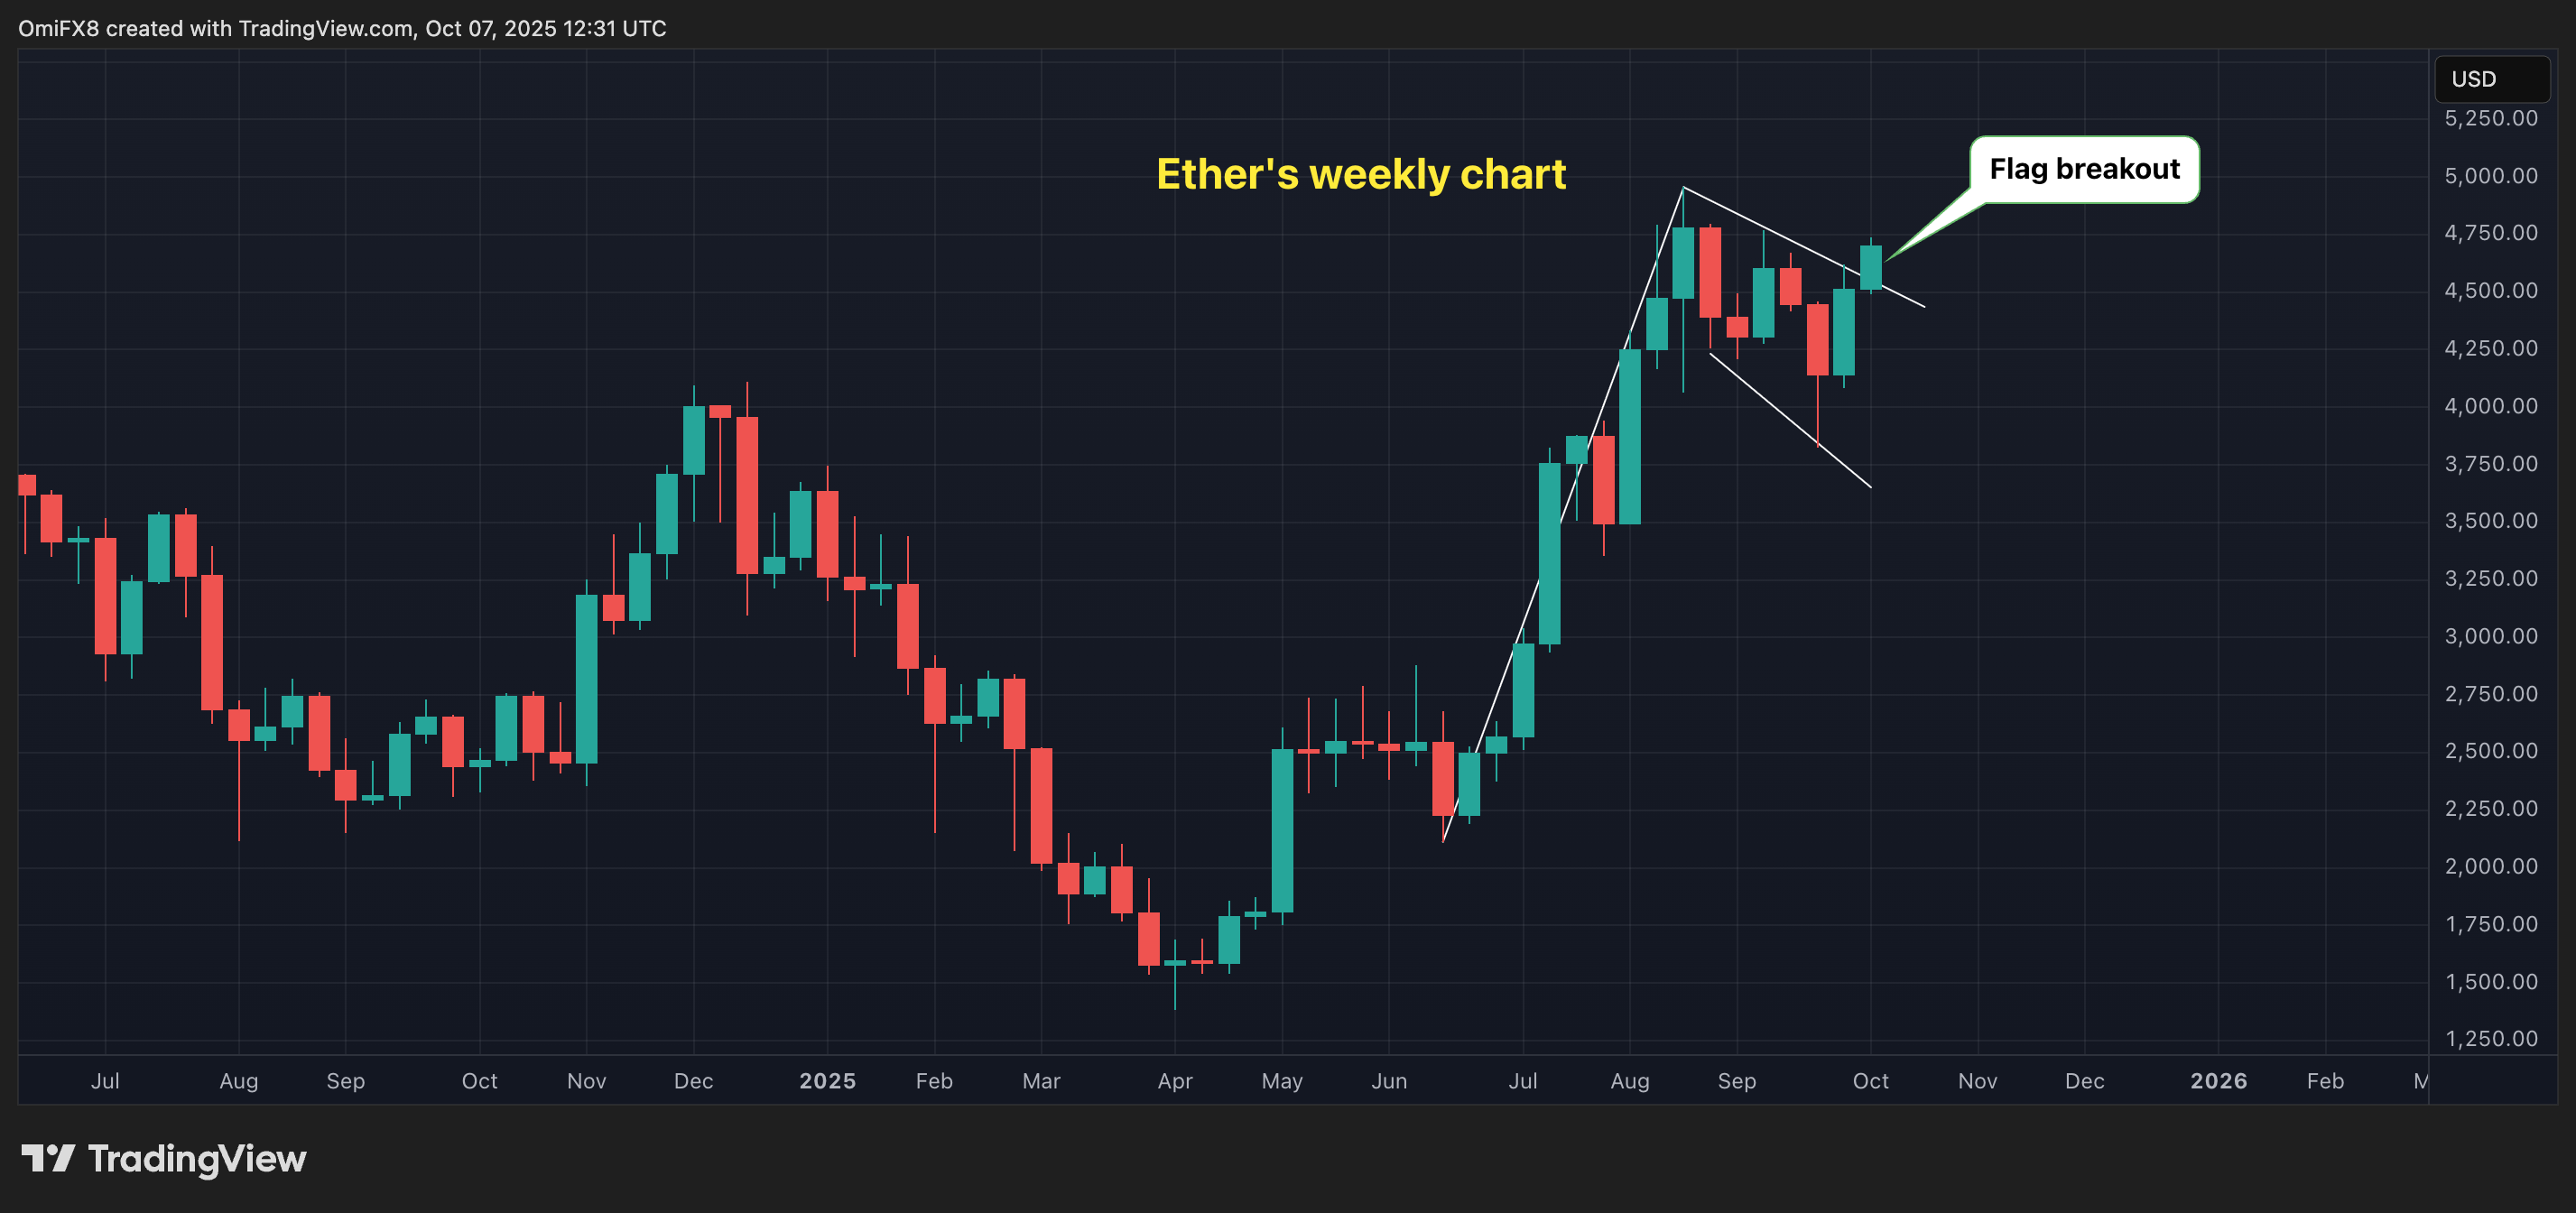
ETH: Bull flag breakout
Ether (ETH) has risen 4% to FORM a bull flag breakout on the weekly chart. A bull flag is a counter-trend consolidation pattern that typically signals a continuation of the preceding upward move. Think of the flag as a pause where tired bulls regroup and gather strength for the next leg up.
Perhaps, a strong rally above $5,000 could be on the horizon. That said, if we see a sell-off from here leading to losses by week’s end, it WOULD be a clear signal that bears are taking control.