Red September Alert: Bitcoin Faces Potential Slide to $100K After 6% Monthly Plunge

Bitcoin's September stumble sparks fresh volatility fears as the flagship crypto posts its steepest monthly decline in over a year.
The 6% monthly drop—Bitcoin's worst performance since July 2024—has traders bracing for potential further downside toward the $100K psychological threshold.
Market analysts point to typical September weakness in risk assets, though some see the pullback as healthy consolidation after Bitcoin's relentless rally toward its current cycle highs.
Traditional finance pundits—who've been wrong about crypto for a decade—are suddenly experts again, predicting doom while quietly adding Bitcoin exposure to their personal portfolios.
This temporary setback might just be the discount window smart money's been waiting for.
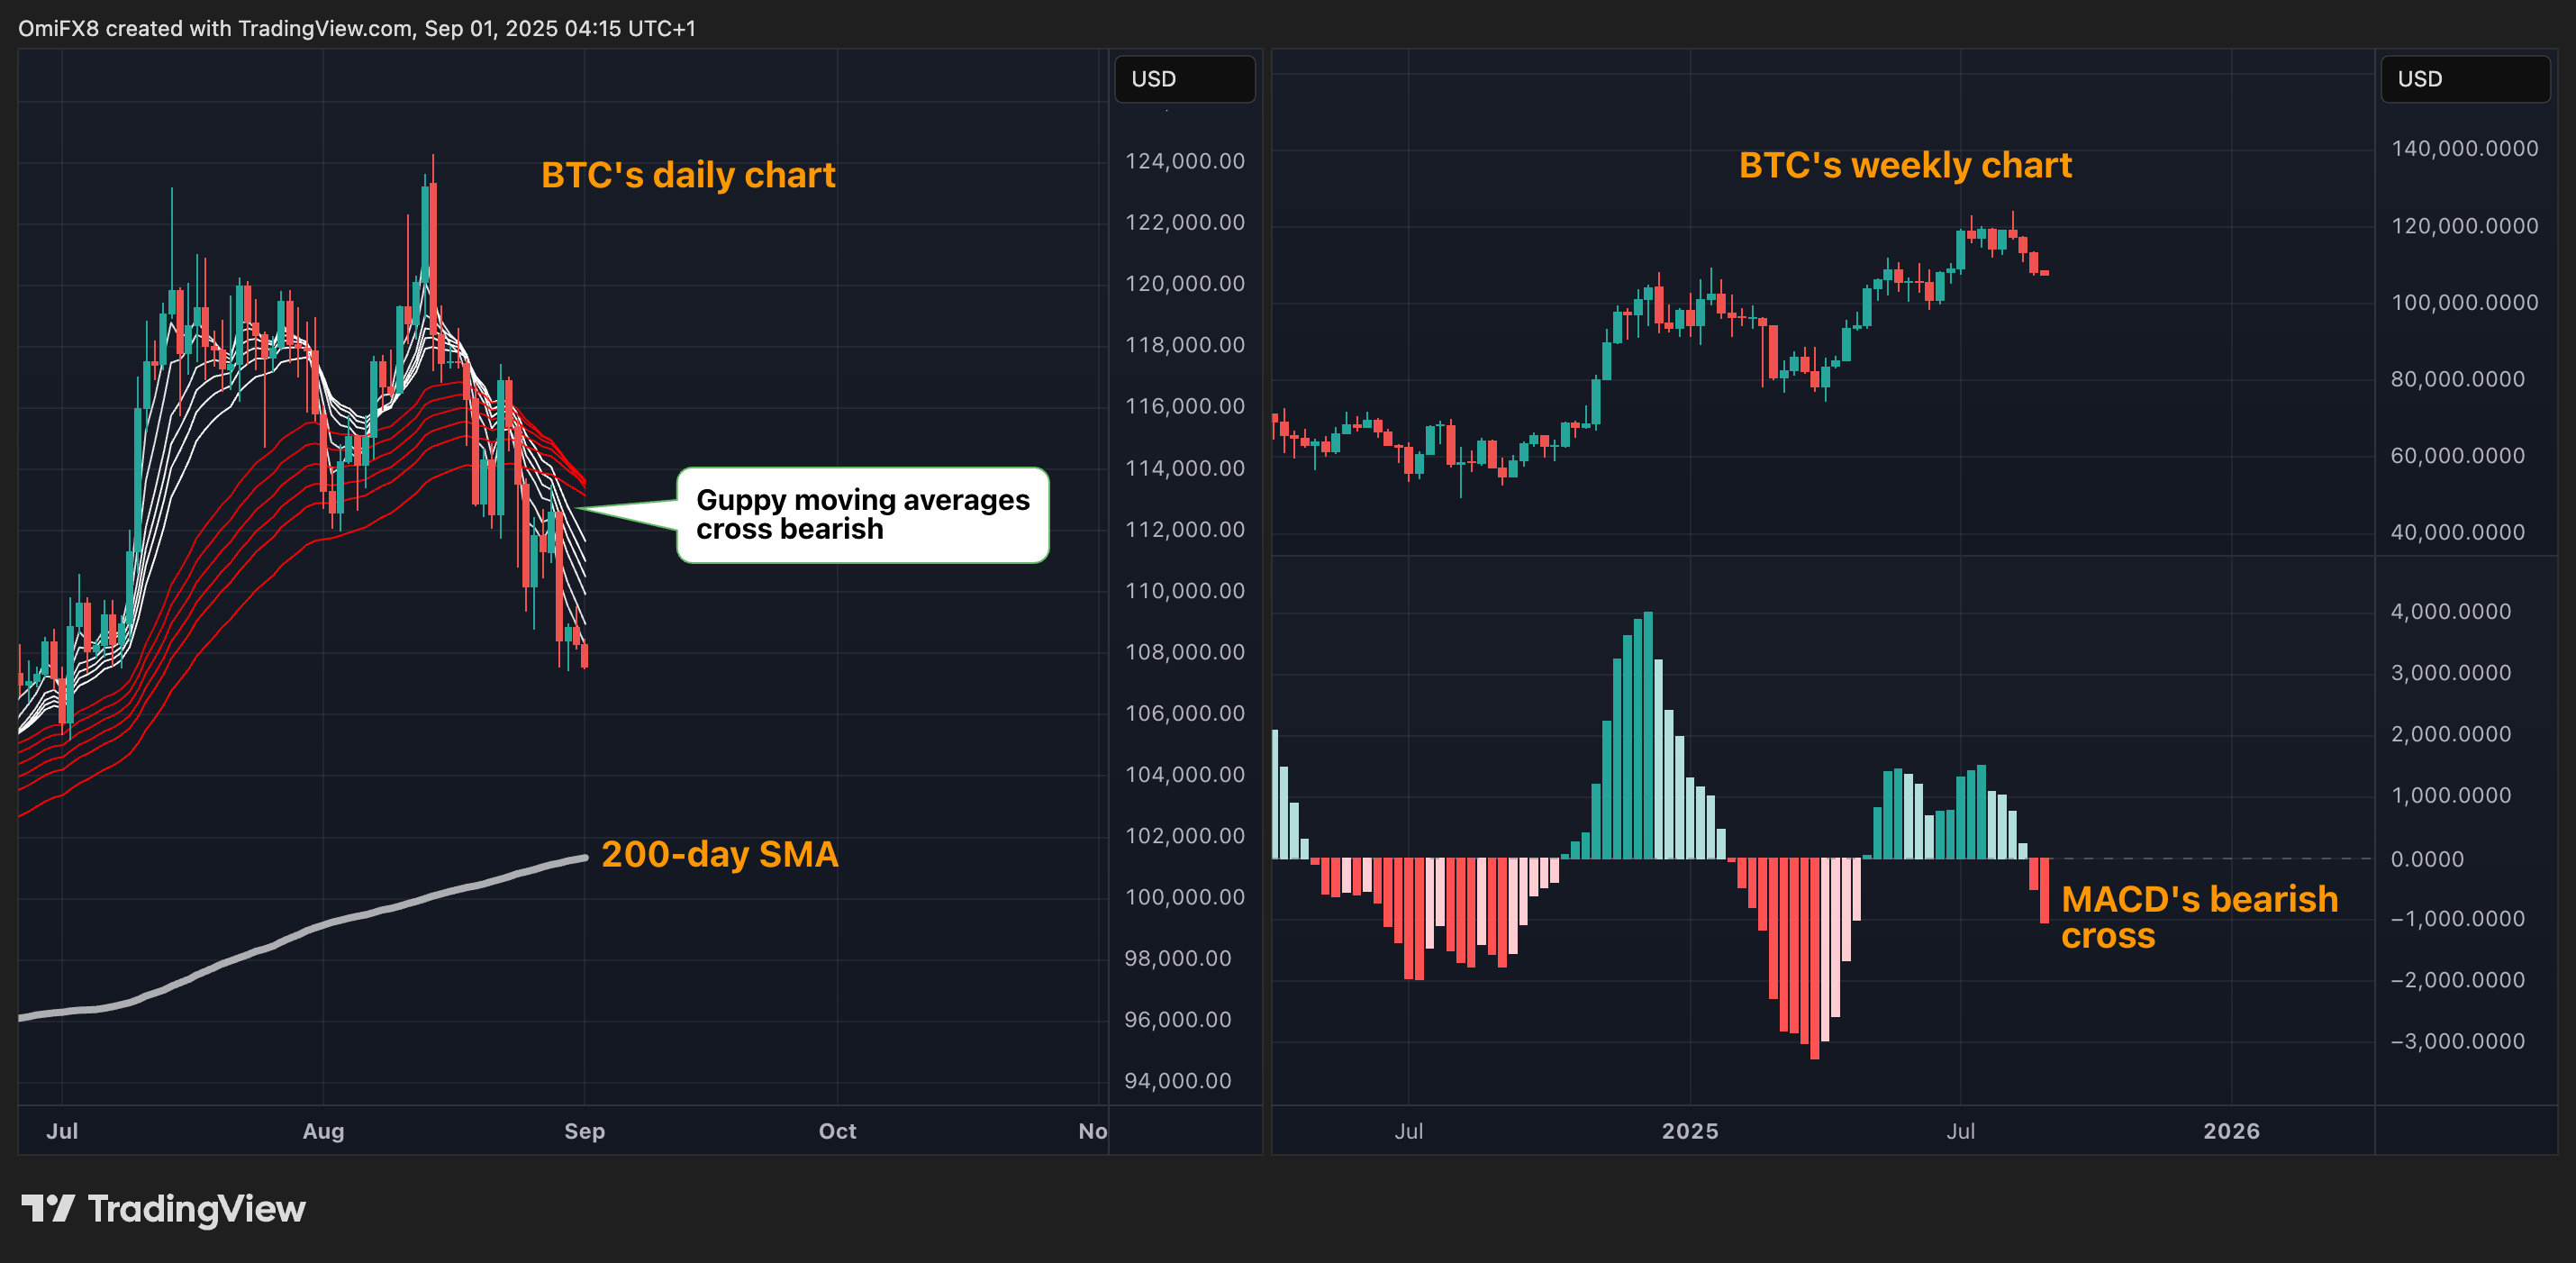
These breakdowns underscore growing market weakness, confirming a bearish shift in key momentum indicators such as the Guppy Multiple Moving Average (GMMA) and the MACD histogram.
The short-term exponential moving average (EMA) band of the GMMA (green) has crossed below the longer-term band (red), signaling a clear bearish momentum shift. Meanwhile, the weekly MACD histogram has dropped below zero, indicating a transition from a bullish to a bearish trend.
Together, these signals indicate a likelihood of a sustained sell-off, potentially driving the price down to the 200-day simple moving average (SMA) at $101,366, and possibly to the $100,000 mark.
The negative technical outlook aligns with seasonal trends, which show September historically as a bearish month for bitcoin. Since 2013, BTC has delivered an average return of -3.49%, closing lower in eight of the past 12 September months, according to data from Coinglass.
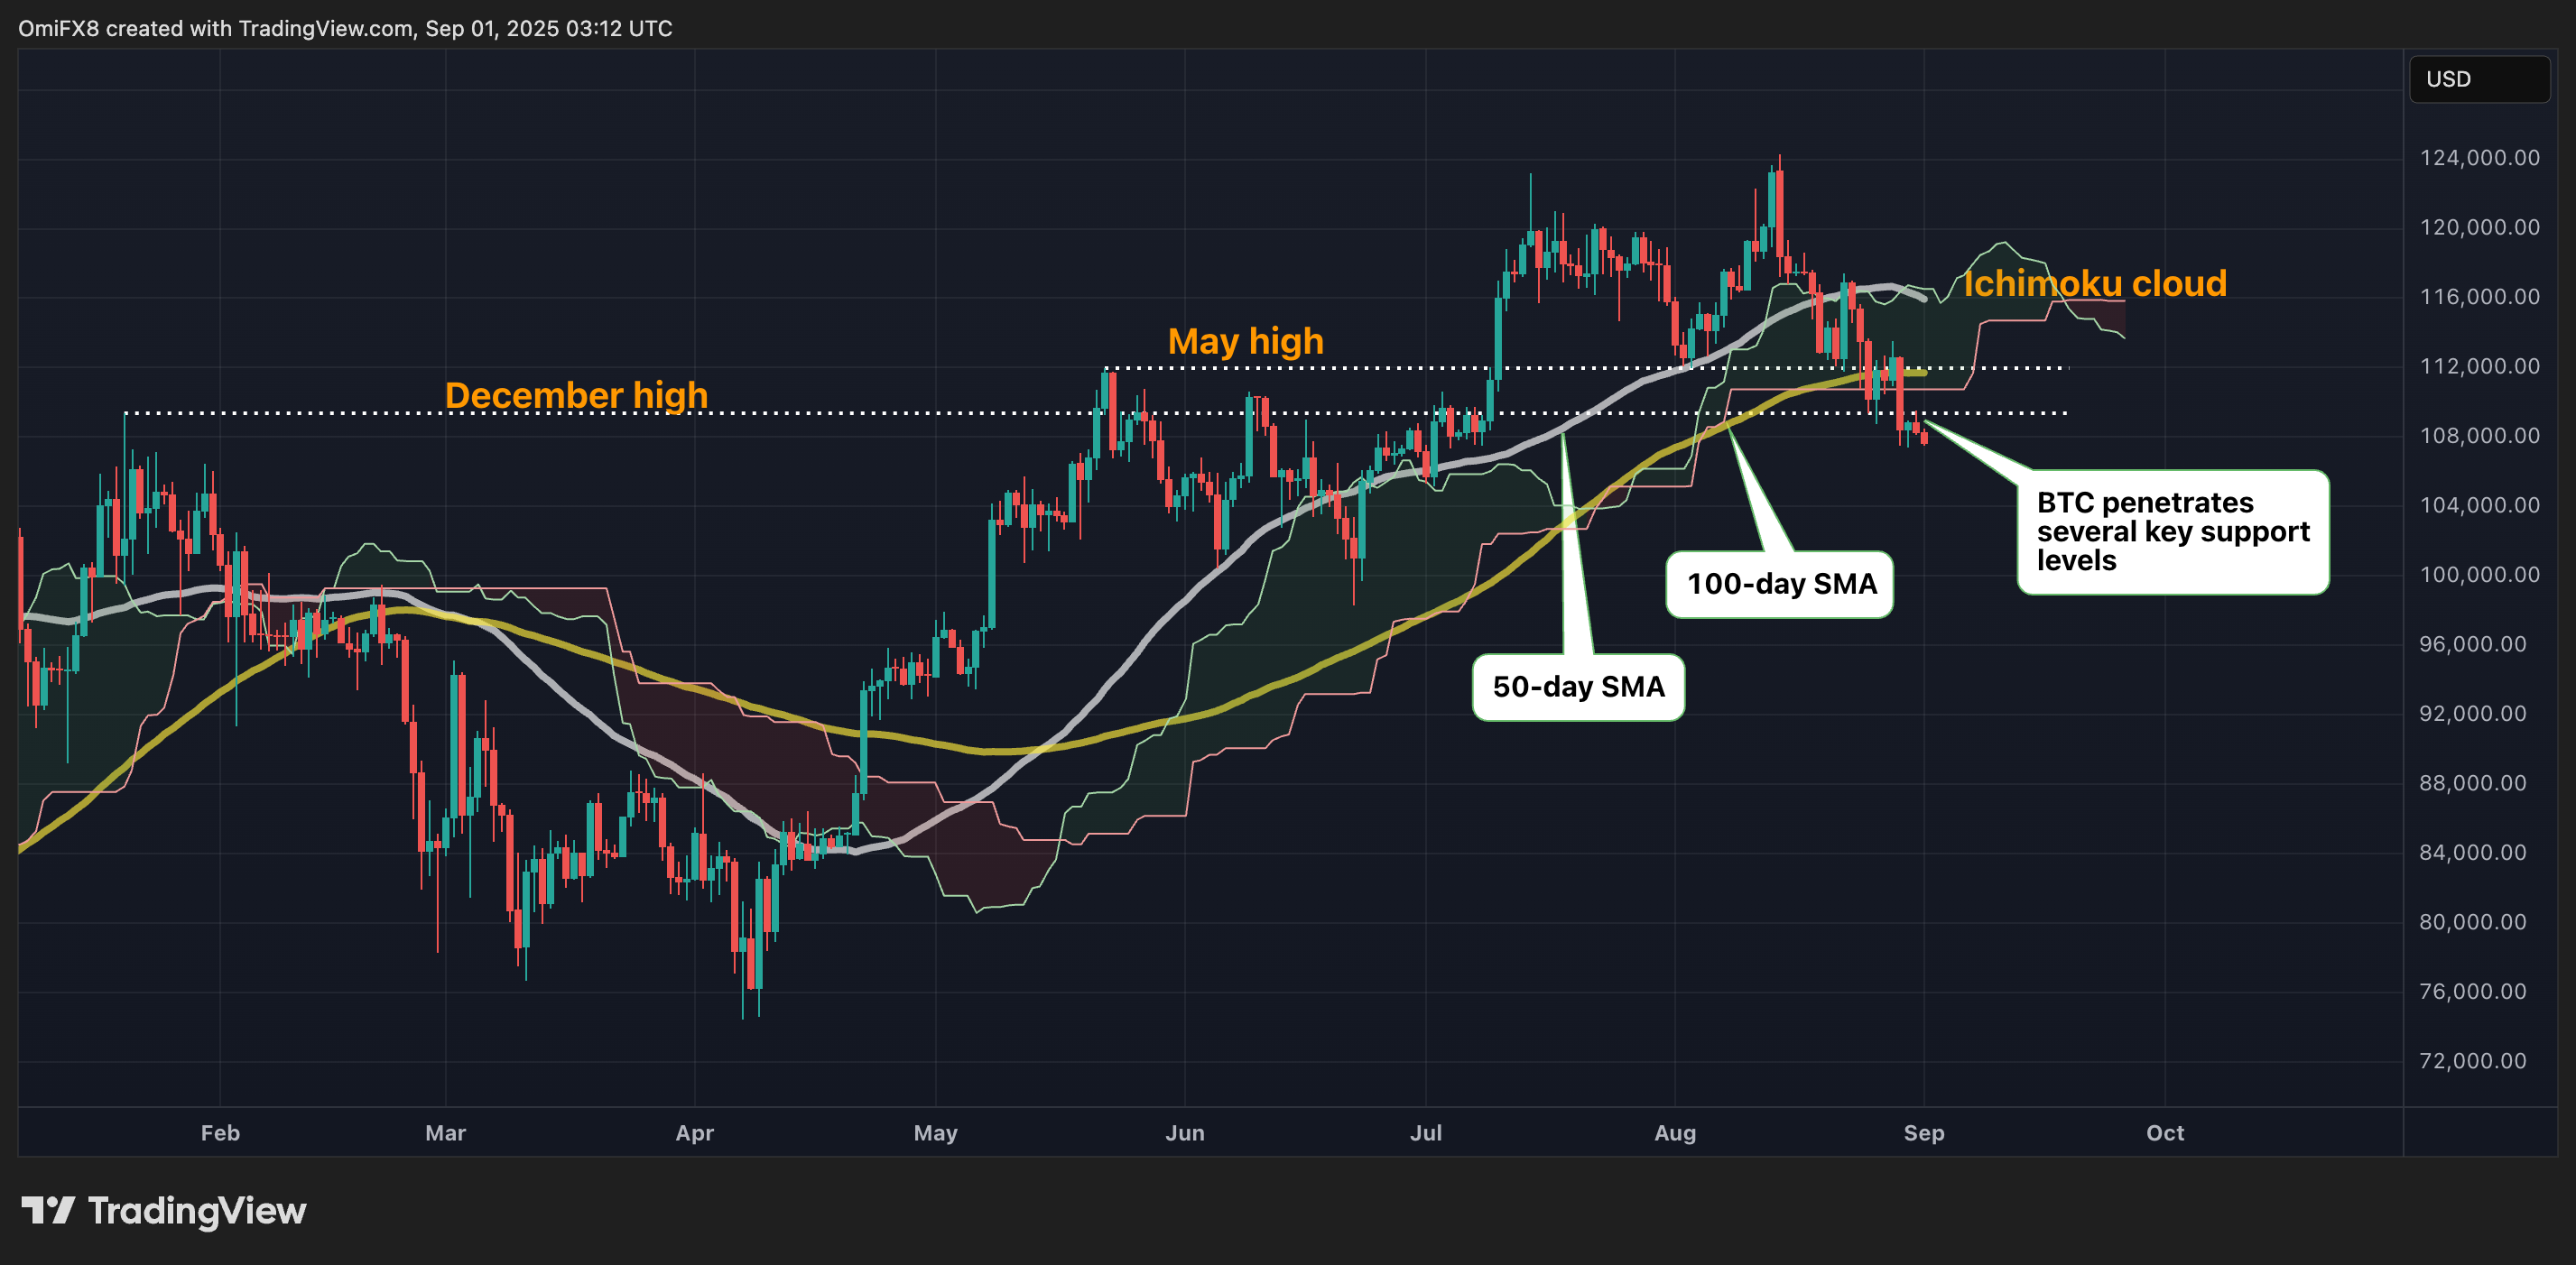
As for bulls, overcoming the lower high of $113,510 set on Aug. 28 is crucial to negating the bearish outlook.
- Support: $105,240 (the 38.2% Fib retracement of the April-August rally), $101,366 (the 200-day SMA), $100,000.
- Resistance: $110,756 (the lower end of the Ichimoku cloud), $113,510 (the lower high), $115,938 (the 50-day SMA).
