ETH Liquidity Surge: Is Ethereum Finally Closing the Gap on Bitcoin?

Ethereum's liquidity engine just hit overdrive—while Bitcoin watches from the rearview.
The Tidal Shift
ETH's trading volumes aren't just rising; they're eating into Bitcoin's dominance. Market depth on major exchanges shows Ethereum's order books thickening faster than Bitcoin's—a silent but seismic shift in crypto's liquidity landscape.
Institutional Money Talks
Hedge funds and market makers are pivoting hard into ETH derivatives and spot markets. Why? Higher yield opportunities and—let's be real—the desperate hunt for returns in a market where traditional finance still thinks 'blockchain' is a fancy Excel feature.
The DeFi Factor
Ethereum’s ecosystem isn’t just trading—it’s working. Liquidity pools, staking yields, and perpetual swaps create a self-reinforcing cycle that Bitcoin’s simpler asset model can’t match. Bitcoin stores value; Ethereum prints it.
But Here’s the Catch
Bitcoin’s liquidity remains king for large-block trades. Whales still need BTC’s deeper pools to move millions without moving markets. Ethereum catches up? Maybe. Overtakes? Not yet—but the gap’s narrowing faster than a leveraged trader’s margin account.
1. Realized cap: measuring new capital inflows
Realized cap tracks the net USD-denominated capital invested in a token, reflecting the cumulative cost basis of all holders. Since the cycle low in November 2022, ETH has absorbedin fresh capital inflows, pushing its realized cap to a new all-time high ofas of August 8th, 2025.
For context, this represents afor ETH over the period — substantial, but still well below bitcoin’srise in realized cap. The slower growth rate suggests that while ETH has been attracting meaningful new investment, there may still be ample room for expansion as institutional interest accelerates.
2. Unhedged spot ETH ETF demand: tracking institutional allocation
In our Bitcoin study, we developed a method to estimate genuine institutional demand by isolating ETF inflows not tied to hedged arbitrage trades. Applying this framework to ETH shows thatare likely genuine institutional allocations, with the remainder driven by arbitrage strategies — long spot positions hedged via CME futures to capture price differentials.
Interestingly, the proportion of arbitrage-related flows is much higher for ETH than bitcoin, where only aroundof spot ether ETF inflows are estimated to be arbitrage-based. This highlights that institutional allocation to ETH still lags behind BTC, though we expect this gap to close gradually with the recent influx of institutional interest in the cryptocurrency.
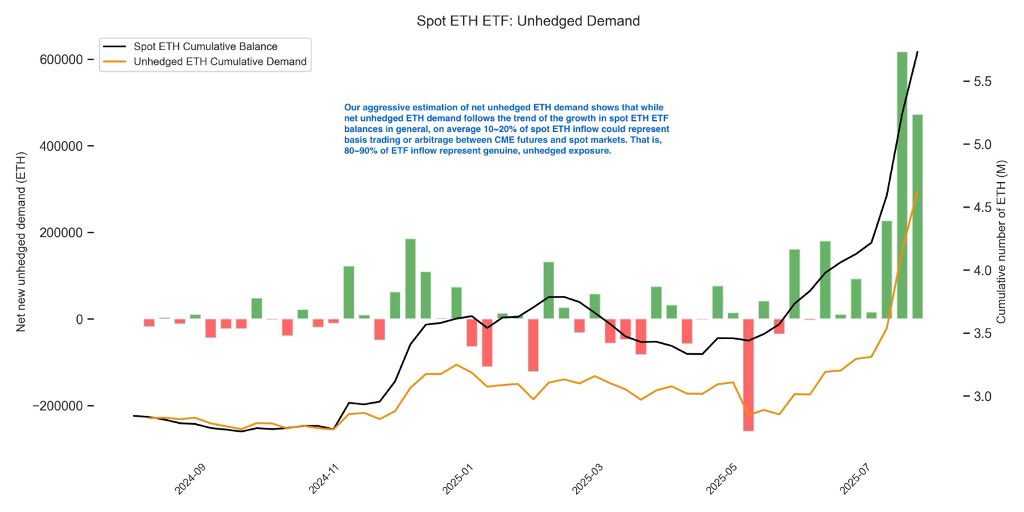
Data source: Avenir, CFTC, Glassnode
3. Futures and options open interest: gauging derivatives growth
As of July 21st, combined open interest (OI) in ETH futures and options stood at. However, unlike bitcoin — where OI in perpetual futures and options is nearly balanced — ETH options OI remains less than half of perpetual futures OI.
Given that options are more often used by professional traders and institutions, this imbalance indicates that institutional derivatives participation in ETH still has significant room to grow.
4. Limit order book imbalance: reading market sentiment
Order book analysis reveals notable sentiment shifts. When ETH regained $3,800 in July after 7 months, a strong sell-side skew emerged on the limit order books (LOB), suggesting intense, long-awaited profit-taking. But as the price retraced toward $3,300, buy-side depth increased significantly, signaling “buy-the-dip” behavior at that level. Since then, the order book has shown a more balanced supply-demand profile, suggesting no extreme positioning from the market at present.
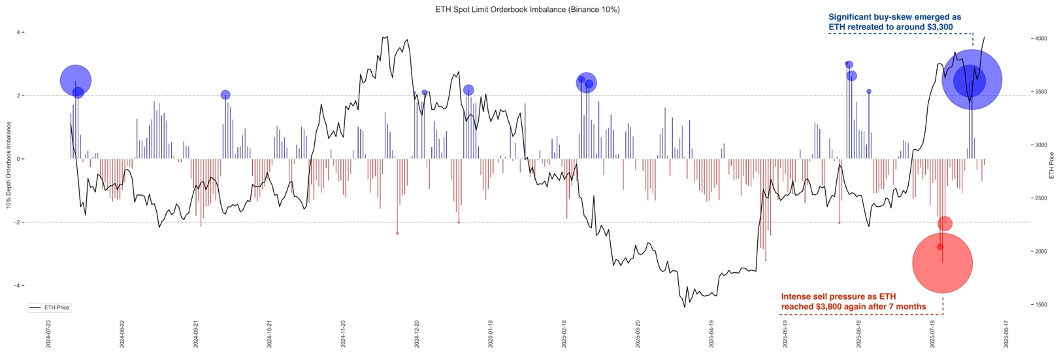
Data source: Avenir, Binance
5. Digital asset treasuries (DATs): growing structural buyers of ETH
A new and increasingly important source of demand for ETH comes from DATs — corporations that diversify into ETH by holding it on their balance sheets. For example, Bitmine and Sharplink are two of the most notable representatives of this trend.
Since April, DATs have accumulated roughly), representing aboutof the circulating supply; Bitmine alone accounts for 1.3%. For context, U.S. spot ETH ETFs currently hold 5.4% of ETH total supply. This highlights the scale of these structural allocations from DATs.
What sets DAT flows apart is their long-duration nature. Unlike futures traders or ETF arbitrage inflows, treasury allocations are less likely to rotate capital frequently, making them a source of sticky structural demand.
Conclusion
Across on-chain and off-chain liquidity metrics, one theme is clear:. Realized cap growth, ETF inflow composition and derivatives market structure all point to significant untapped potential.
At the same time, DAT allocations are becoming a powerful driver of sustained ETH flows, much like how corporate balance sheet strategies such as Strategy created a new structural demand channel that helped fuel bitcoin’s rally in late 2024.
If institutional adoption of ETH follows a trajectory similar to bitcoin’s, the coming months could see meaningful capital inflows, and with them, the potential for outsized performance.
