Bitcoin Market Structure ’Still Looks Extremely Bullish’—FalconX Head of Research Reveals Why

Bitcoin's underlying architecture continues flashing green signals despite recent volatility—and one top analyst says the fundamentals haven't looked this strong in years.
Market Mechanics Favor Bulls
Institutional accumulation patterns, shrinking exchange reserves, and robust network activity all point toward sustained upward momentum. The data suggests smart money keeps positioning for higher prices while retail hesitates.
Liquidity Dynamics Shift
Supply shock indicators hit levels typically seen before major breakouts. Whales keep swallowing available supply faster than miners can produce new coins—creating textbook scarcity conditions.
Traditional Finance Still Playing Catch-Up
Meanwhile, Wall Street veterans continue debating whether crypto's 'a real asset class' while missing the most obvious bull market of their careers. Some things never change.
The technical setup screams opportunity—but will institutions wake up before retail FOMO kicks in again?
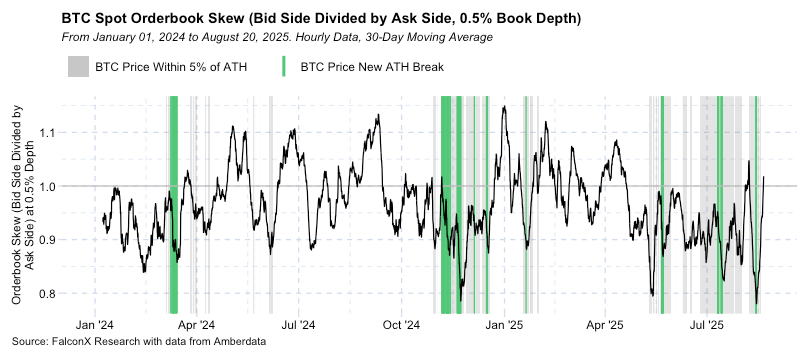
The chart Lawant shared reinforces this interpretation. It shows periods where Bitcoin slipped slightly from record levels, only for buy orders to quickly surge ahead of sell orders.
This repeated shift toward the bid side is a hallmark of a bullish market structure, since it demonstrates that demand is waiting in the wings to absorb any supply that comes to market. For traders, the takeaway is that bitcoin’s resilience after dips points to strong underlying support.
While bitcoin is still below its Aug. 14 peak of $124,481, the pattern highlighted by Lawant — sellers vanishing quickly and buyers reasserting control — continues to underpin bullish sentiment among analysts who see dips as opportunities rather than warning signs.
- According to CoinDesk Research's technical analysis data model, between Aug. 19, 17:00 UTC and Aug. 20, 16:00 UTC, bitcoin fluctuated within a $1,899.78 range, trading between a low of $112,437.99 and a high of $114,337.77.
- Around 13:00 UTC on Aug. 20, the price fell to $112,652.09 amid liquidation pressure before staging a strong rebound.
- The recovery was supported by high trading activity: 14,643 BTC changed hands, compared to a 24-hour average of 9,356 BTC.
- This surge established $112,400–$112,650 as a key volume-backed support corridor.
- In the final hour of the analysis period (15:47–16:46 UTC), bitcoin rose from $113,863.05 to $114,302.43 before closing at $113,983.06.
- The rally broke through resistance at $113,500, $113,650 and $114,000, aided by elevated volumes of 250+ BTC per minute, signaling the start of a short-term uptrend.
Parts of this article were generated with the assistance from AI tools and reviewed by our editorial team to ensure accuracy and adherence to our standards. For more information, see CoinDesk's full AI Policy.
