Bitcoin’s Tepid Rebound Fails to Mask Looming $112K Support Test - Here’s Why Bulls Should Worry

Bitcoin's latest bounce lacks conviction—traders eye critical $112K support as downside pressure builds.
Technical Breakdown: Why This Rally Feels Different
The king crypto's feeble attempt at recovery screams distribution, not accumulation. Every marginal gain gets met with instant selling pressure—classic bear market behavior that should make any serious trader reach for the stop-loss button.
Market Psychology: The Fear Nobody's Talking About
Institutional money stays sidelined while retail piles into leverage longs exactly at resistance levels. It's like watching amateur night at the casino—except the house always wins when support this crucial gets tested.
Where Smart Money Places Bets
Meanwhile, whales accumulate at these levels knowing full well $112K represents make-or-break territory. They're betting the farm on retail panic selling right at the bottom—again. Some things never change in crypto, do they?
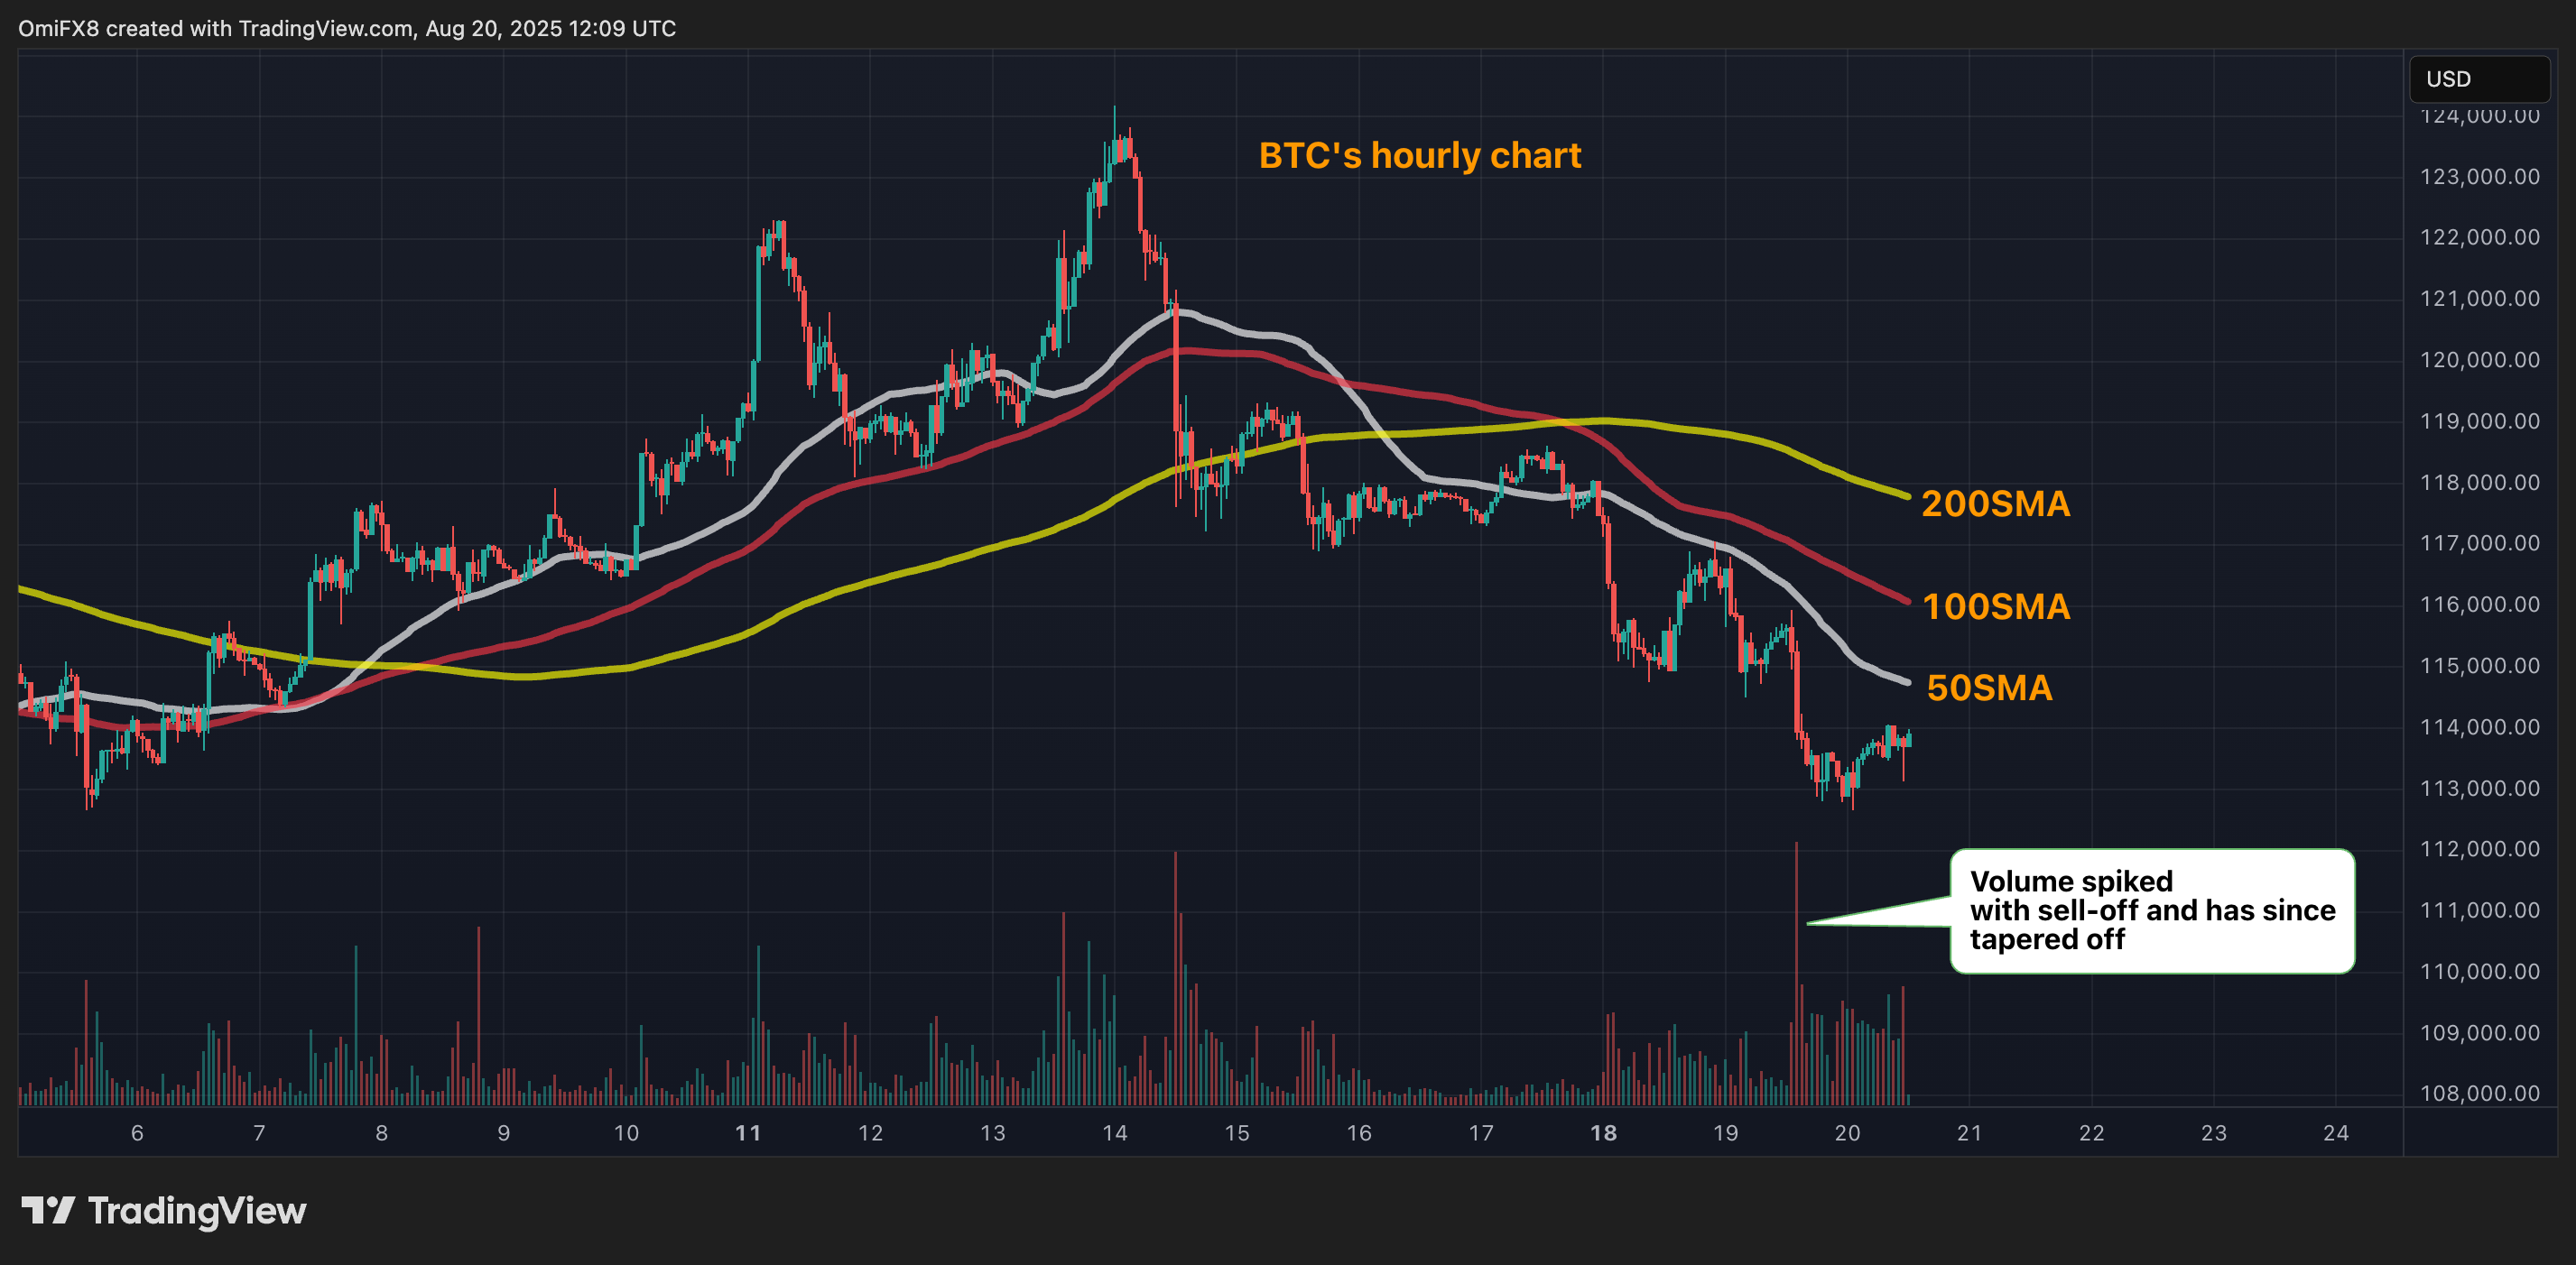
The weak bounce is consistent with bearish momentum signals, as the 50-, 100-, and 200-hour simple moving averages (SMAs) are aligned in descending order and trending downward.
On the daily chart, prices have convincingly broken below the rising trendline support, signaling a shift from bullish to bearish momentum. Both the longer-term MACD histogram (50,100,9) and the more commonly used MACD (12,26,0) are showing increasing negative momentum, with deeper bars below the zero line.
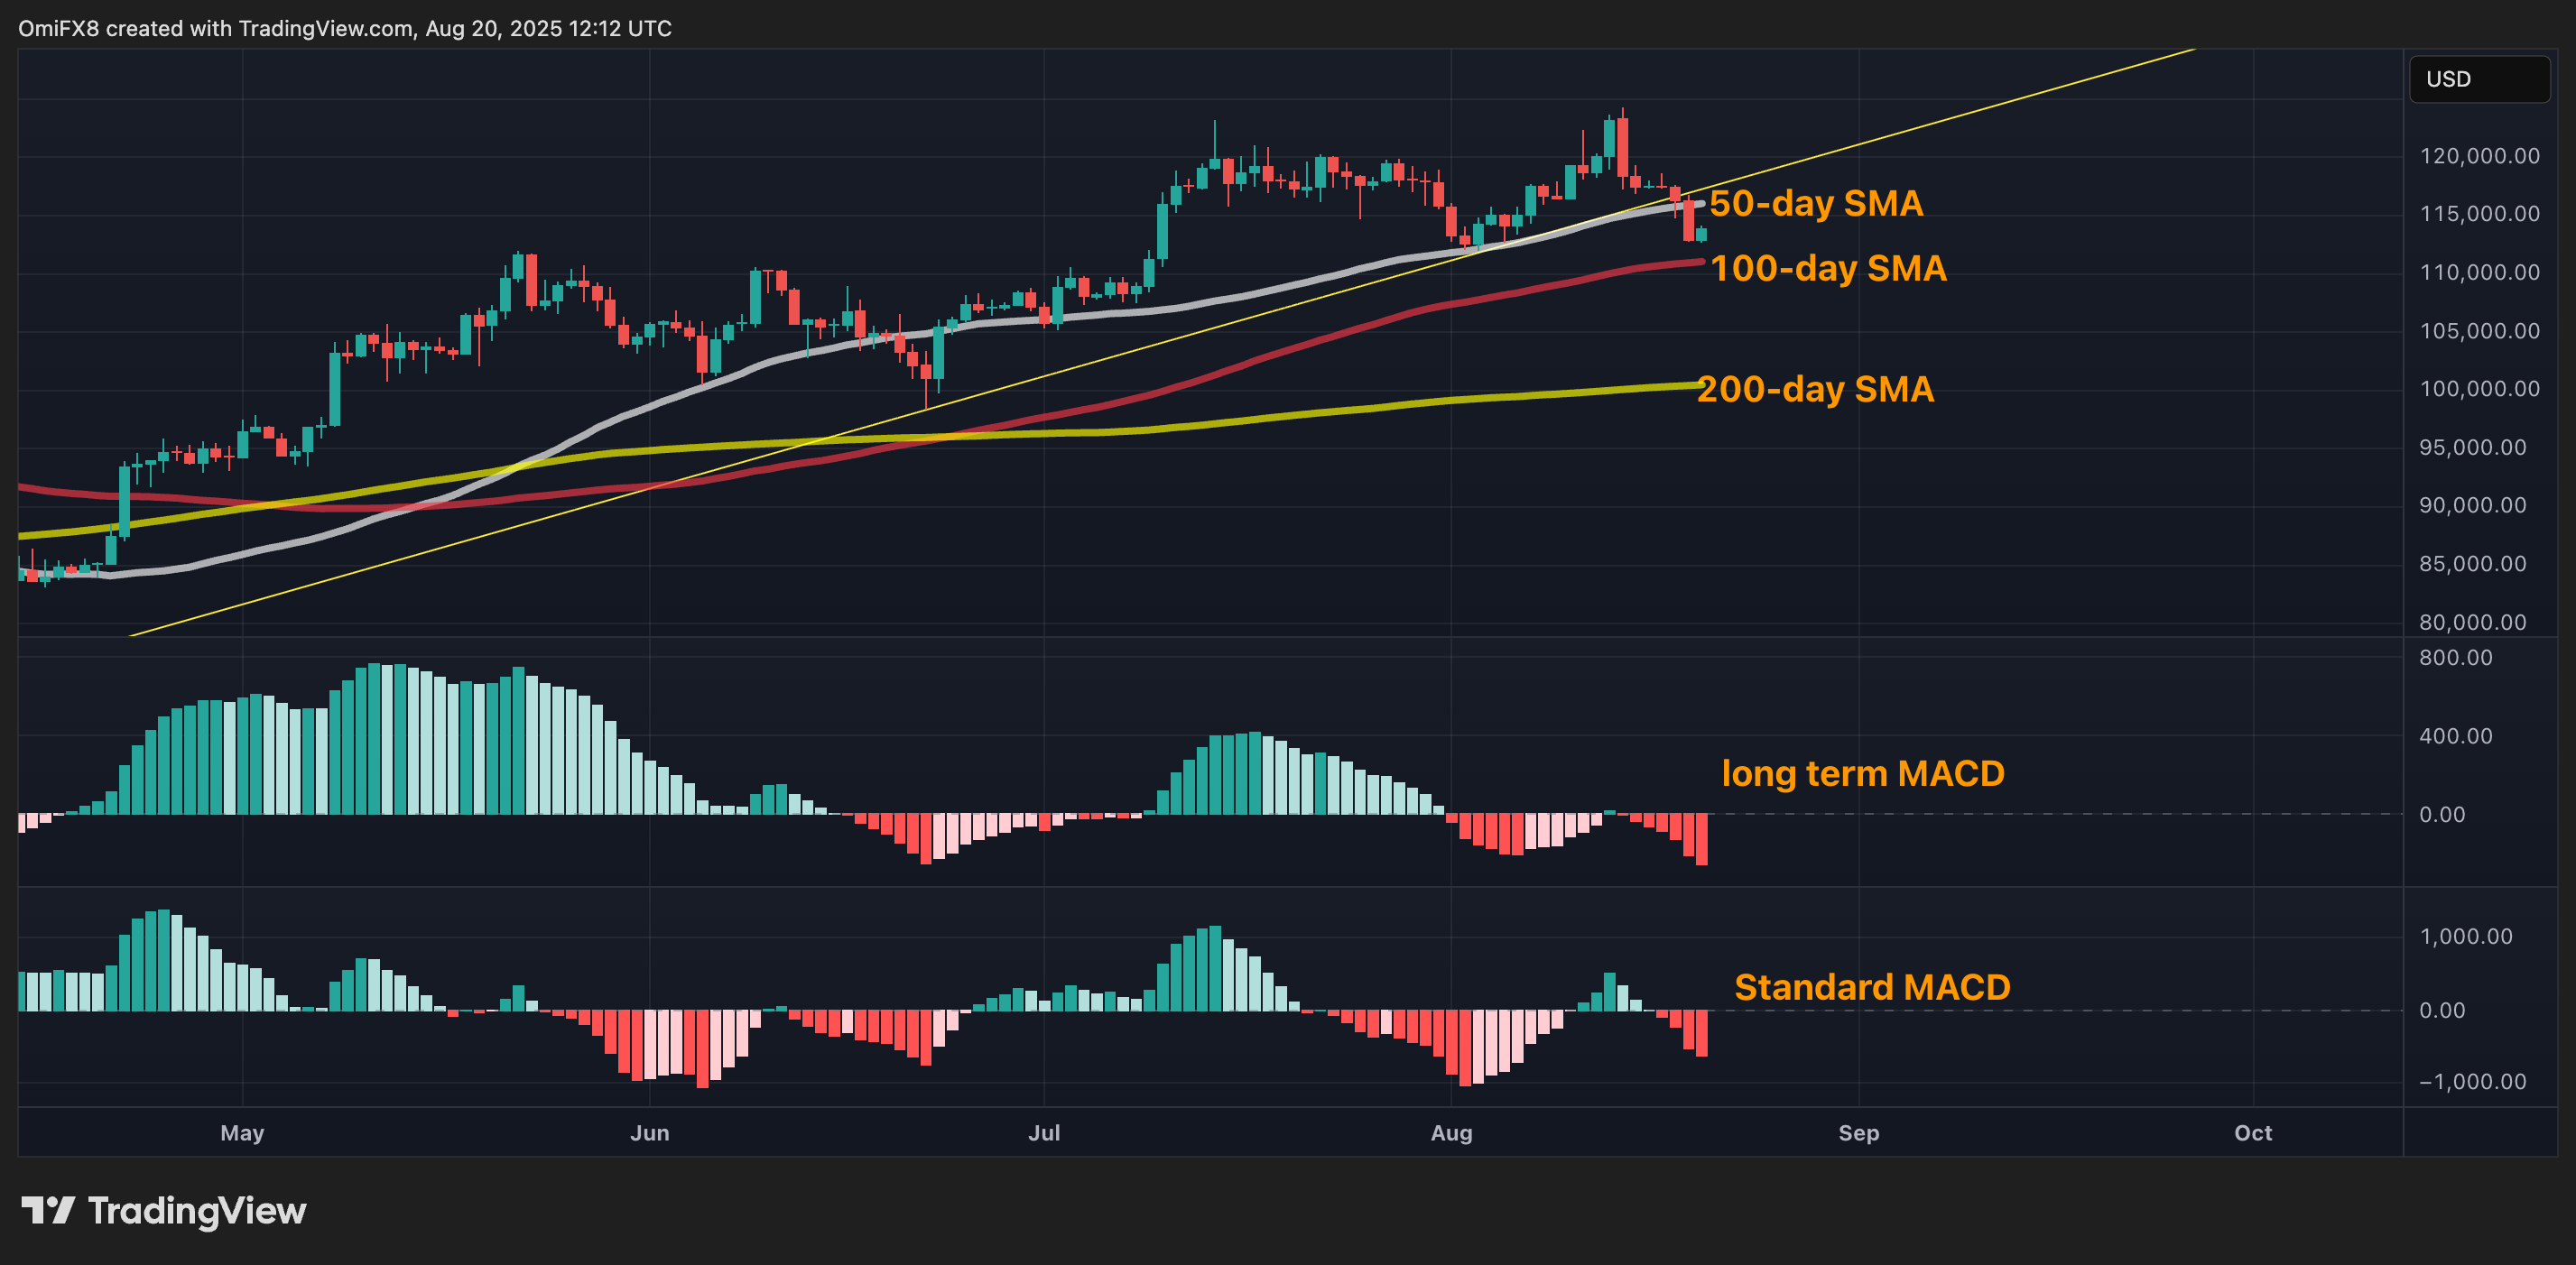
Therefore, the odds appear to be stacked in favor of a continued move lower. The first level of support is $11,982, from which the market turned higher on Aug. 3. The 100-day SMA is seen at $11,053. If these levels are taken out, the focus WOULD shift to the 200-day SMA at $100,484.
A convincing MOVE above the 50-day SMA at $116,033 would negate the bearish outlook.
- Resistance: $116,033, $120,000, $122,056.
- Support: $111,982, $110,053, $100,484.
