Bitcoin at a Tipping Point: BTC Price Shatters Key Bullish Trendline – What’s Next?

Bitcoin's relentless volatility strikes again as BTC punches through a critical support trendline that bulls had clung to for months. The breakdown sparks fresh debate about crypto's near-term trajectory—just as Wall Street starts pretending to care about 'risk assets' again.
The technical damage: Today's drop below the ascending trendline (dating back to the 2024 lows) signals weakening momentum. Traders are now eyeing the next major support zone around $50K—a level that could either trigger panic or become a springboard for the next leg up.
Market psychology at play: With spot ETF flows stalling and miner reserves dwindling, Bitcoin faces its first real stress test since institutional players jumped aboard. Meanwhile, crypto Twitter oscillates between 'buy the dip' memes and apocalyptic threads.
The silver lining? History shows BTC tends to violate trendlines violently before resuming its march upward. This might just be another shakeout before the halving narrative takes over—assuming traditional finance doesn't screw it up with their 'hedged exposure' nonsense.
Bullish momentum fading
The weekly chart (candlestick format) shows that BTC's ongoing decline follows repeated bull failure to secure a foothold above $122,056, the Fibonacci golden ratio. It also marked the inability to keep gains above the significant long-term resistance trendline that connects the bull market highs of 2017 and 2021.
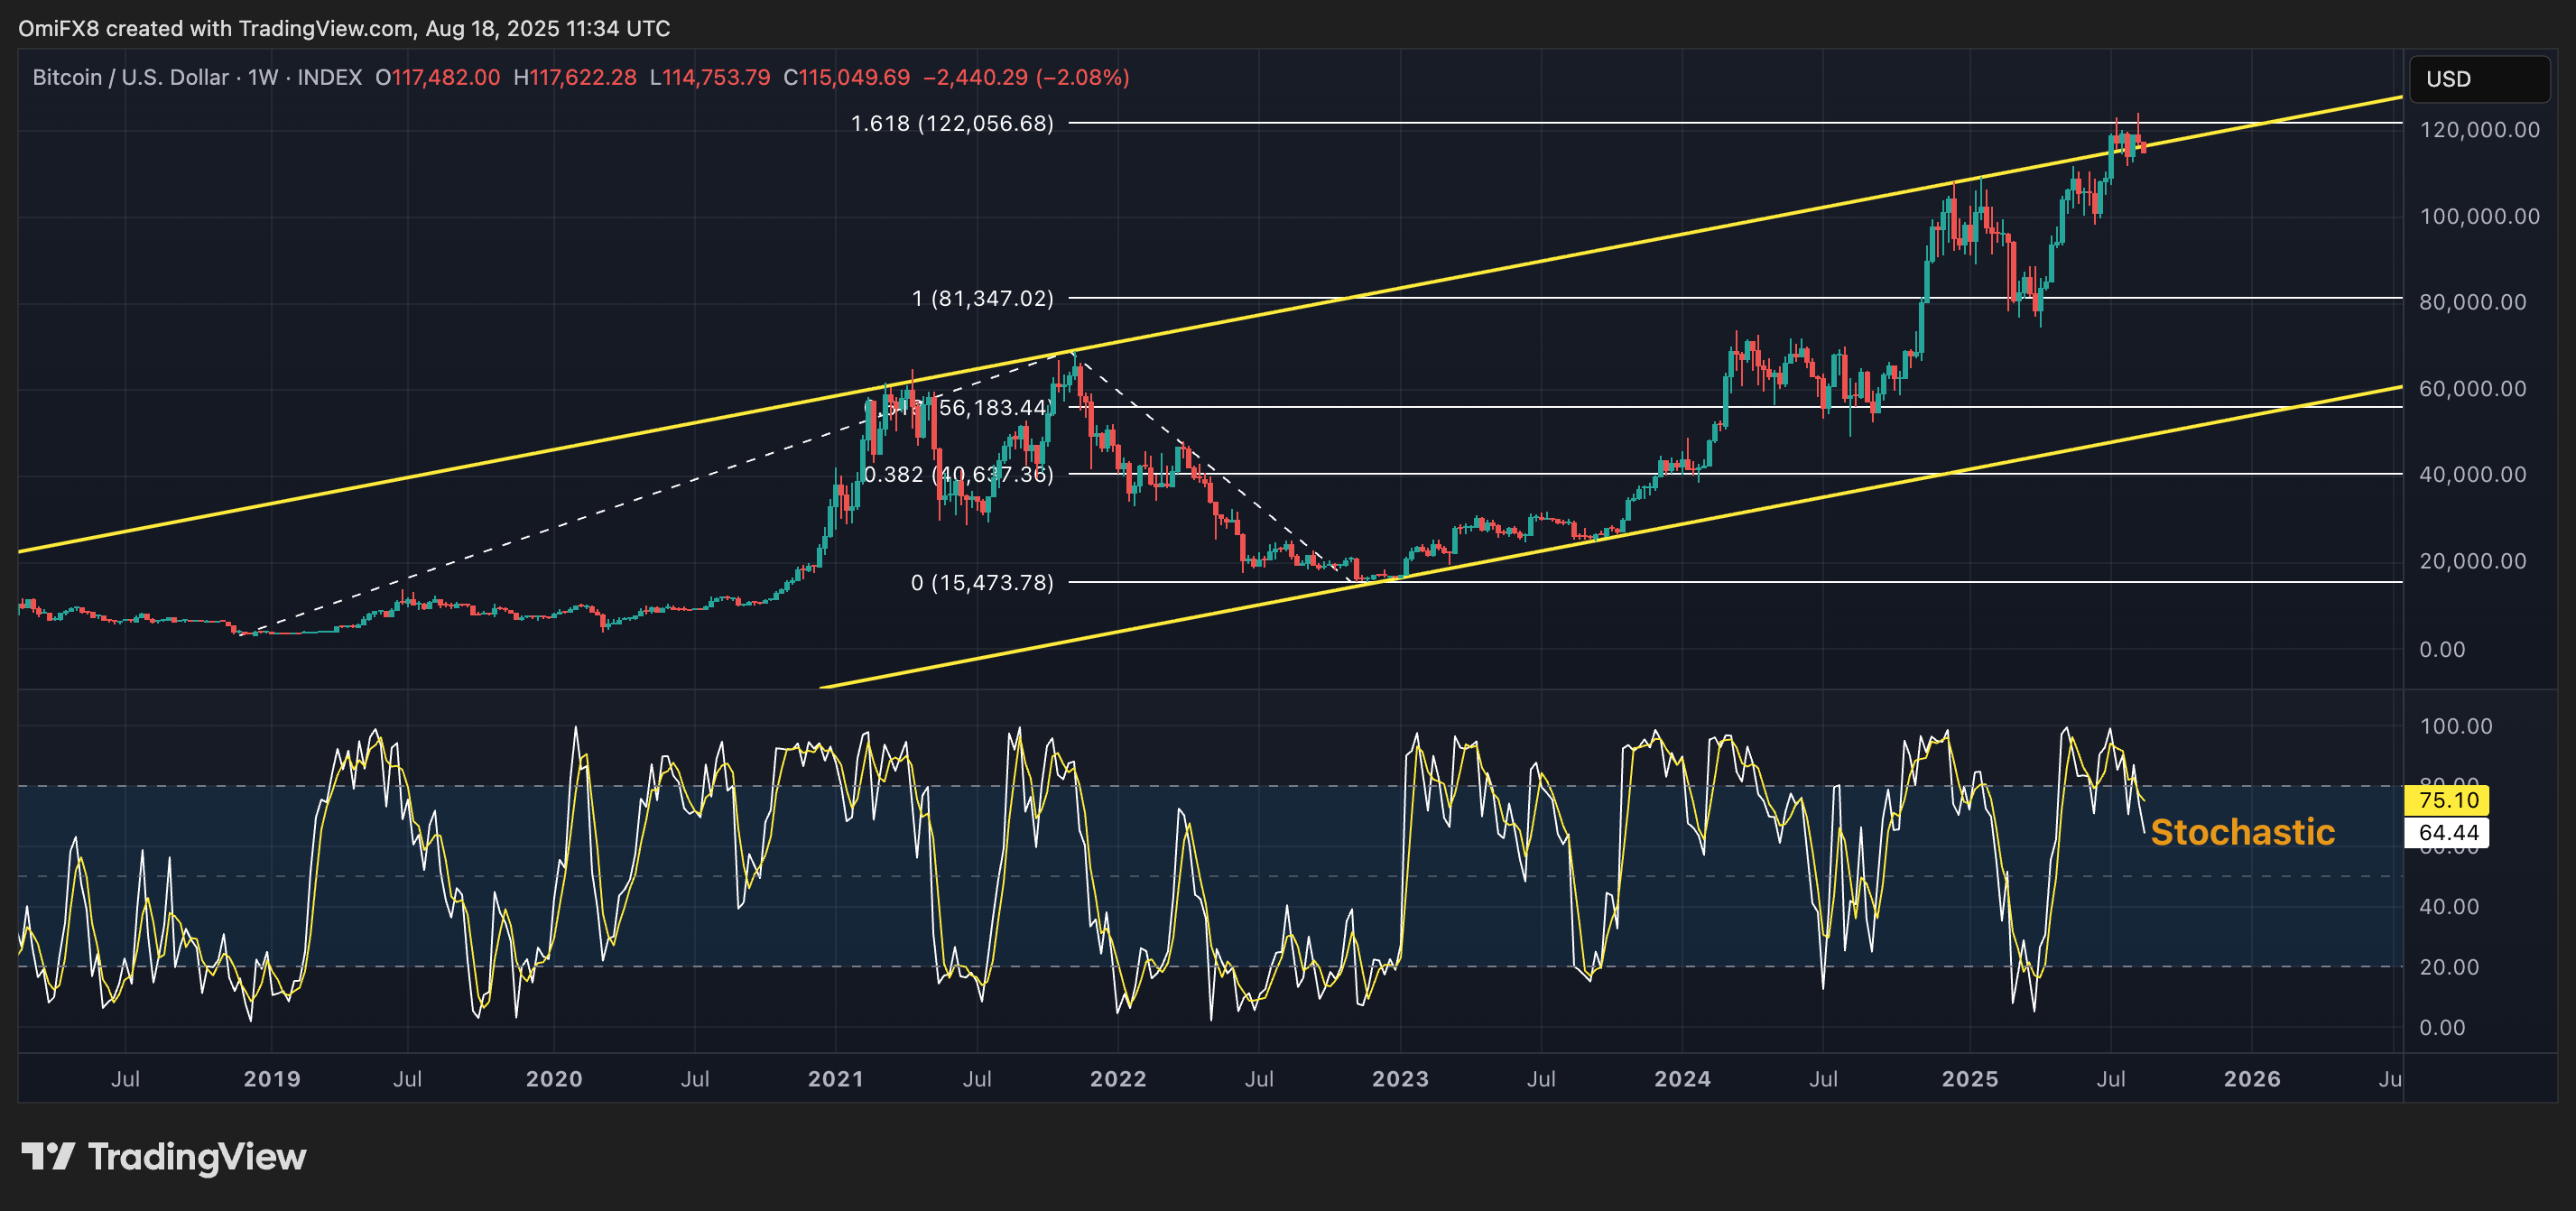
Additionally, the weekly stochastic oscillator has rolled over from the overbought zone above 80, signaling a potential correction ahead.
Daily chart
On the daily chart, BTC’s latest candle has broken below the bullish trendline extending from April lows, following Friday’s bearish outside-day candle that signaled a potential shift toward seller dominance.
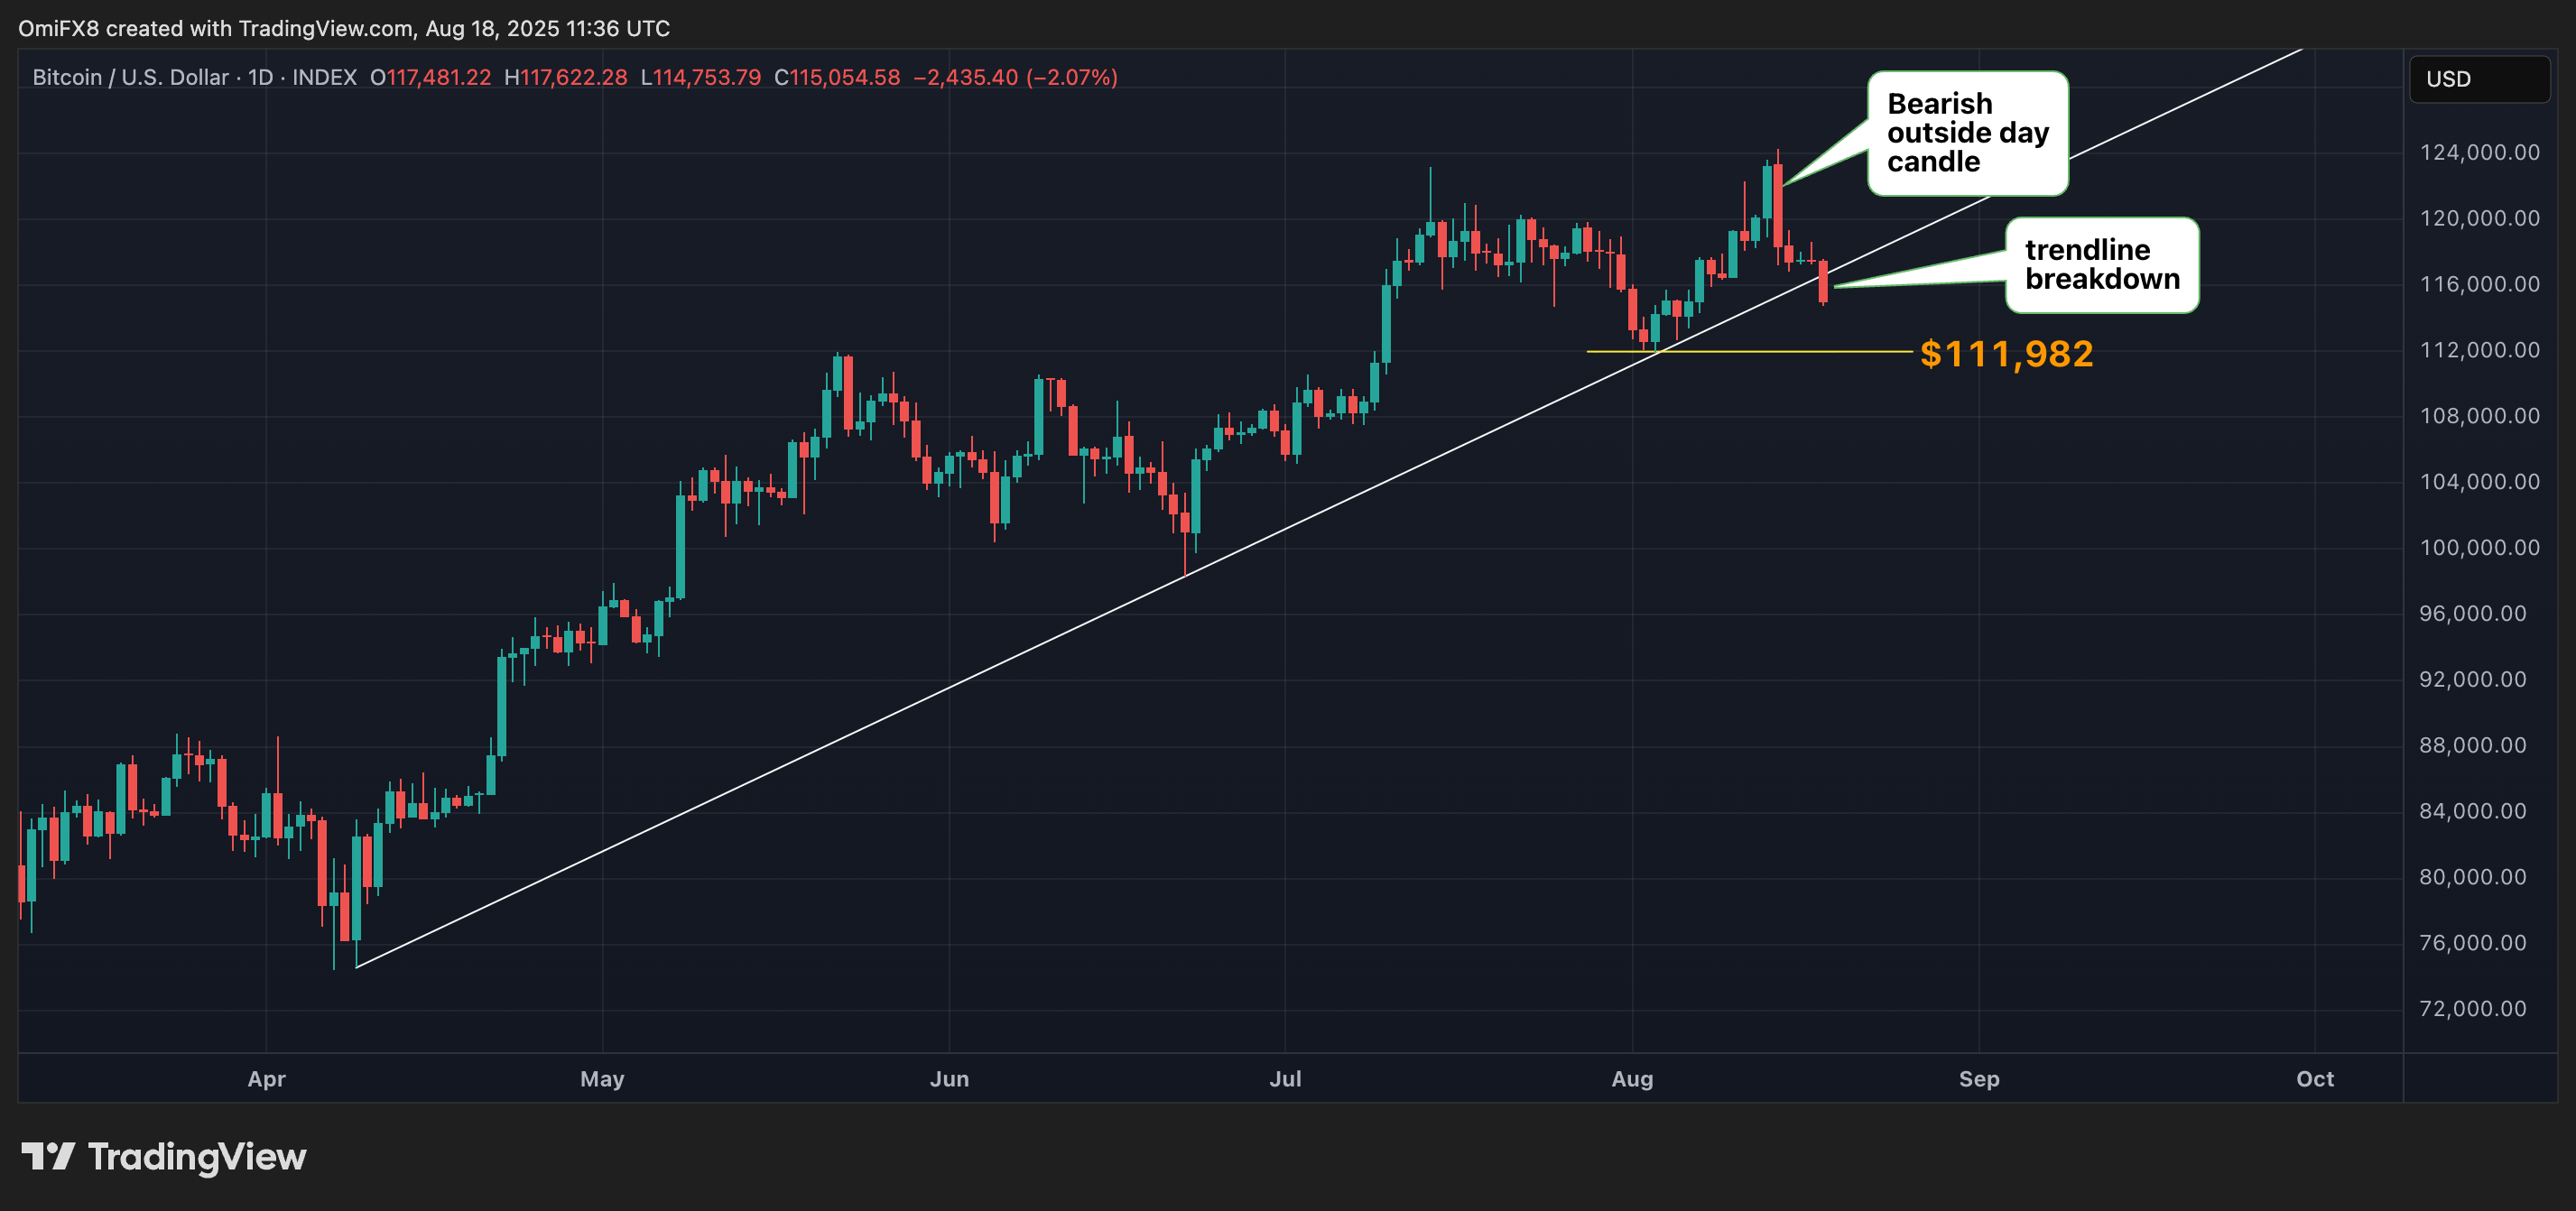
Together, these technical signals indicate an increasing downside risk for BTC in the near term, with a potential retest of $11,982, the point from which the market turned higher on Aug. 3. A violation of this level WOULD shift focus tothe 200-day simple moving average at around $100,000.
A potential reversal higher to above $118,600 (Sunday's high) during the day ahead would weaken the bear case.
- Resistance: $120,000, $122,056, $124,429.
- Support: $111,982, $105,295 (the 31.8% Fib retracement of April-August rally), $100,000.
