Shiba Inu Squeeze Alert: Bollinger Bands Hit Tightest Since Feb 2024 Amid 13% Weekly Plunge

Shiba Inu’s price action just flashed a rare signal—volatility is collapsing. The meme coin’s Bollinger Bands haven’t been this tight in over 17 months, and traders are bracing for a breakout.
Here’s why this technical pattern matters—and why SHIB’s 13% weekly drop might be the calm before the storm.
When bands contract this hard, it’s like coiling a spring. The last time Shiba Inu saw this level of compression? February 2024. What followed was a 60% explosion in three weeks.
Of course, past performance doesn’t guarantee future results—just ask the bagholders still waiting for their ‘2021-style moonshot.’ But with Bitcoin showing signs of life and meme coin volumes creeping up, SHIB’s next move could be explosive.
Will history repeat, or is this just another dead-cat bounce in Dogecoin’s shadow? Place your bets—the casino is open.
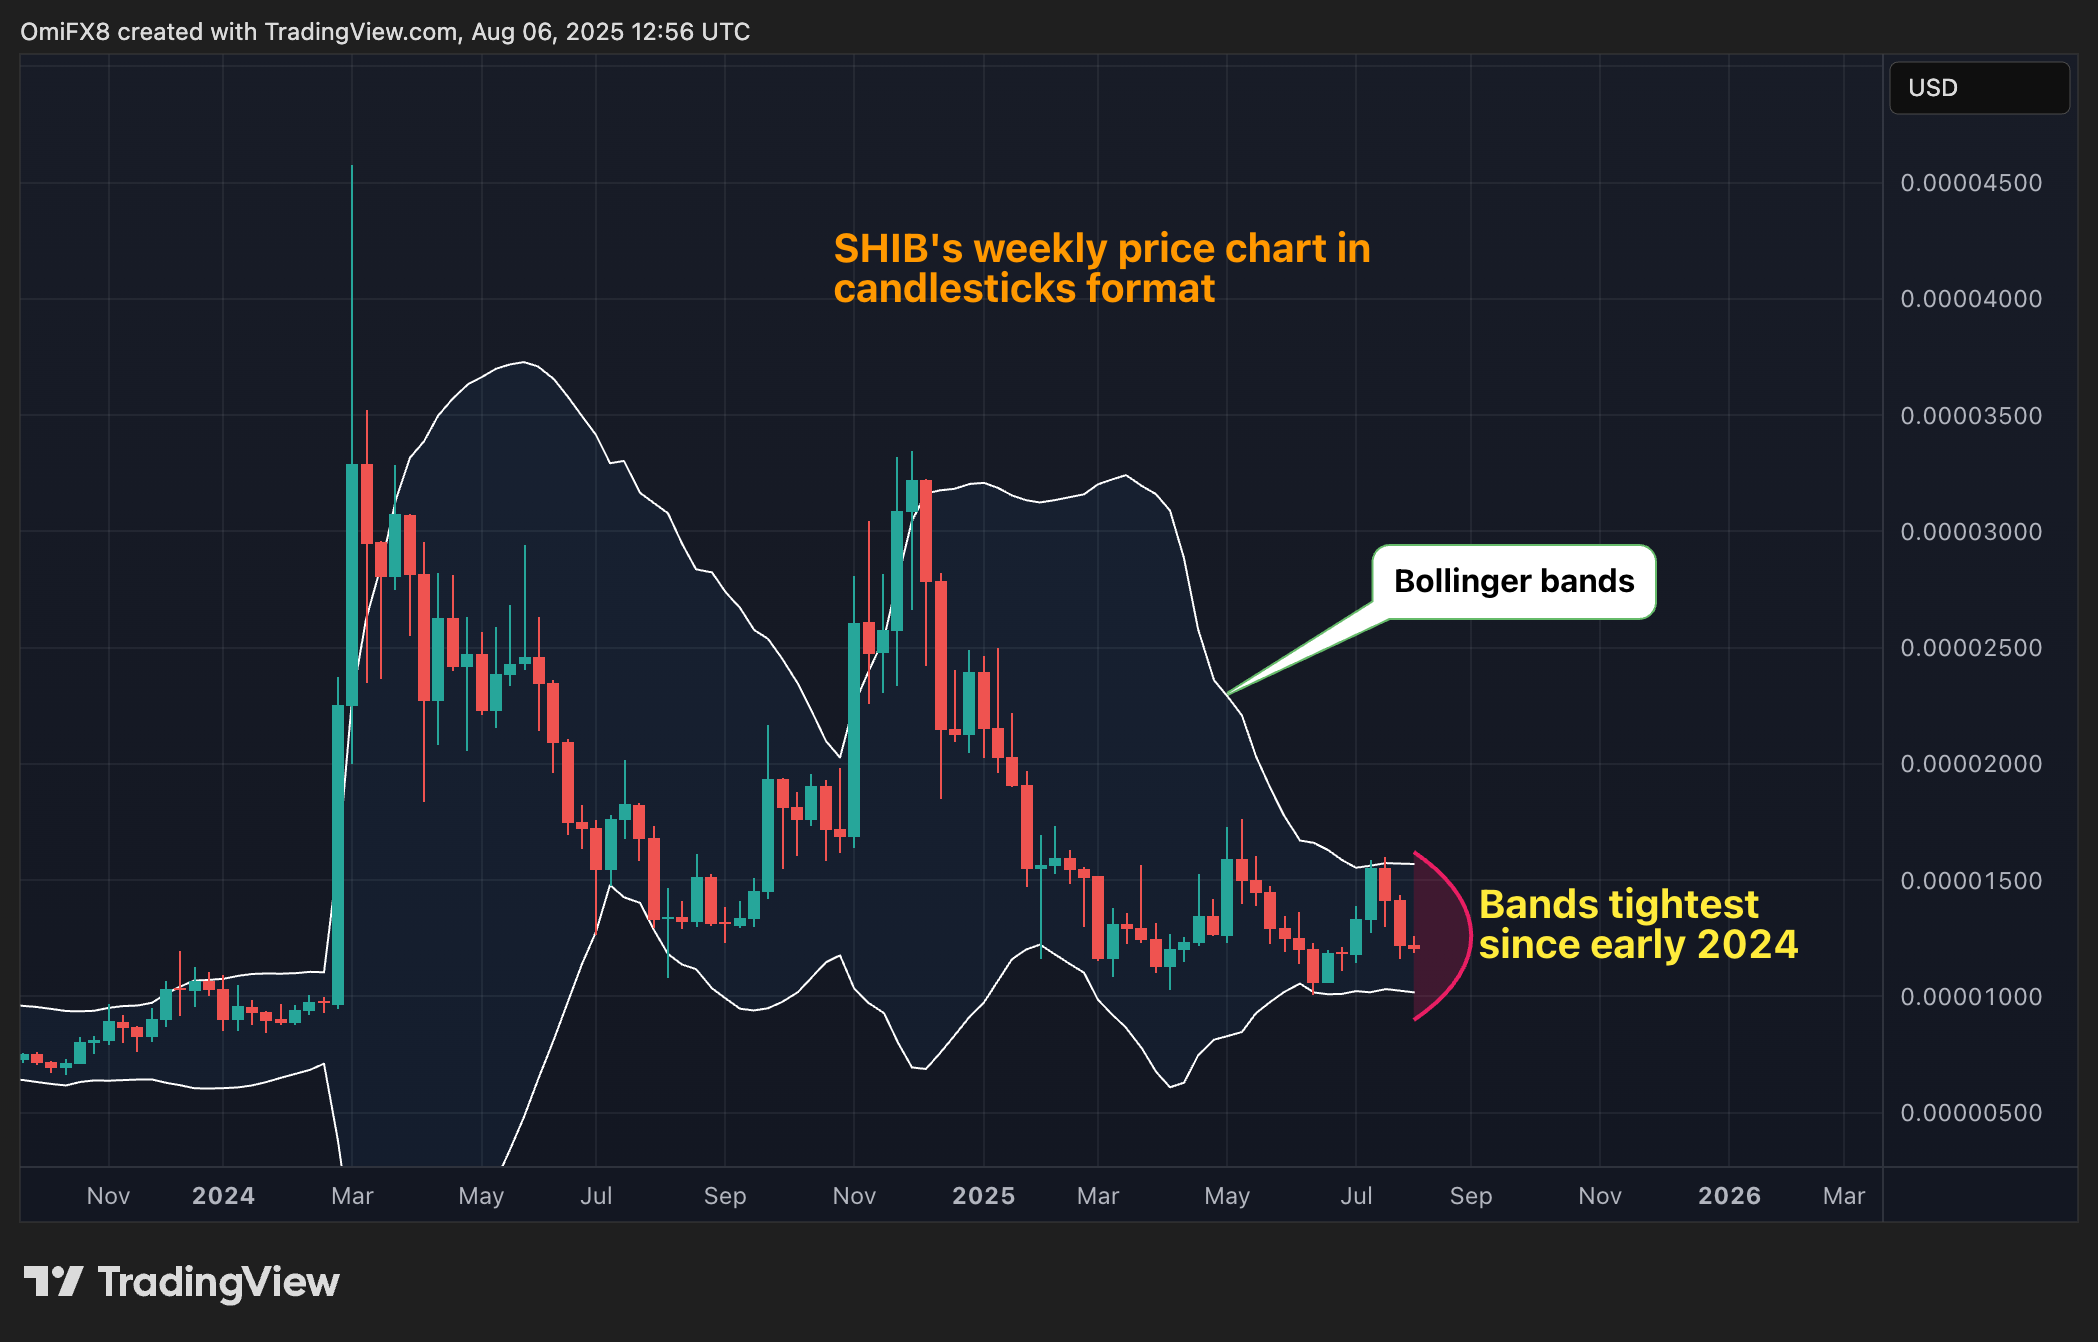
The narrowing of the bands follows consecutive weekly price drops. Notably, prices fell by 13.8% to $0.00001160 last week, the largest decline since the first week of March, according to data source CoinDesk.
Since then, prices have stabilized and recovered, trading above $0.00001200. The cryptocurrency has particularly demonstrated impressive resilience in the past 24 hours, according to CoinDesk Research's technical analysis model.
Key insights
SHIB showcased notable price volatility throughout the 23-hour trading window spanning from August 5, 12:00 to August 6, 11:00, recording a comprehensive range of $0.000003104, which constituted a 25.4% differential between the peak value of $0.000012217 and the trough of $0.000011913.
The digital asset underwent an initial steep correction from $0.000012362 to $0.000011985 in the opening hours, subsequently establishing consolidation patterns NEAR the $0.000012000 threshold before executing a meaningful rebound that elevated prices to $0.000012186 by the period's conclusion, indicating persistent accumulation interest during price weakness.
Throughout the concluding 60-minute interval from August 6 10:23 to 11:22, SHIB displayed exceptional bullish characteristics with continuous upward price action advancing from $0.000012123 to $0.000012198, marking a 0.62% appreciation that strengthened the overarching recovery narrative.
The hourly trading session featured pronounced buying activity with transaction volume surges surpassing 19 billion tokens during pivotal breakout phases, notably around 11:07 when valuations momentarily challenged support at $0.000012125 before continuing the ascent to session peaks of $0.000012198, signaling substantial institutional positioning and validating the asset's capacity to sustain upward momentum beyond key psychological barriers.
Technical Indicators Breakdown
- Valuation range of $0.000003104, constituting a 25% differential between peak and trough figures.
- Initial steep correction from $0.000012362 down to $0.000011985 throughout opening trading hours.
- Consolidation characteristics near $0.000012000 support threshold.
- Recovery momentum is elevating prices toward $0.000012186 by session conclusion.
- Transaction volume surges, surpassing 19 billion tokens throughout breakout phases.
- Support challenge at $0.000012125 before continuing upward price action.
- Session peaks achieved $0.000012198, indicating substantial resistance penetration.
Parts of this article were generated with the assistance from AI tools and reviewed by our editorial team to ensure accuracy and adherence to our standards. For more information, see CoinDesk's full AI Policy.
