Bitcoin Primed for 30% Surge: This Chart Signals the Next Big Rally

Bitcoin's technical setup screams bullish—here's why traders are betting on a major breakout.
### The Pattern That Has Bulls Salivating
A classic bullish reversal formation just triggered on BTC's daily chart. No crystal ball needed—just pure price action.
### Liquidity Zones in Play
Market makers are eyeing those juicy unfilled gaps above current levels. When BTC wants liquidity, it takes liquidity.
### Wall Street's Late-to-the-Party Problem
While institutional analysts finally acknowledge crypto's existence (after a decade), retail traders are already positioned for the move. Some things never change—like banks being fashionably late to profit opportunities.
This isn't financial advice—it's just what the chart says. And right now, that chart's screaming one thing: higher.
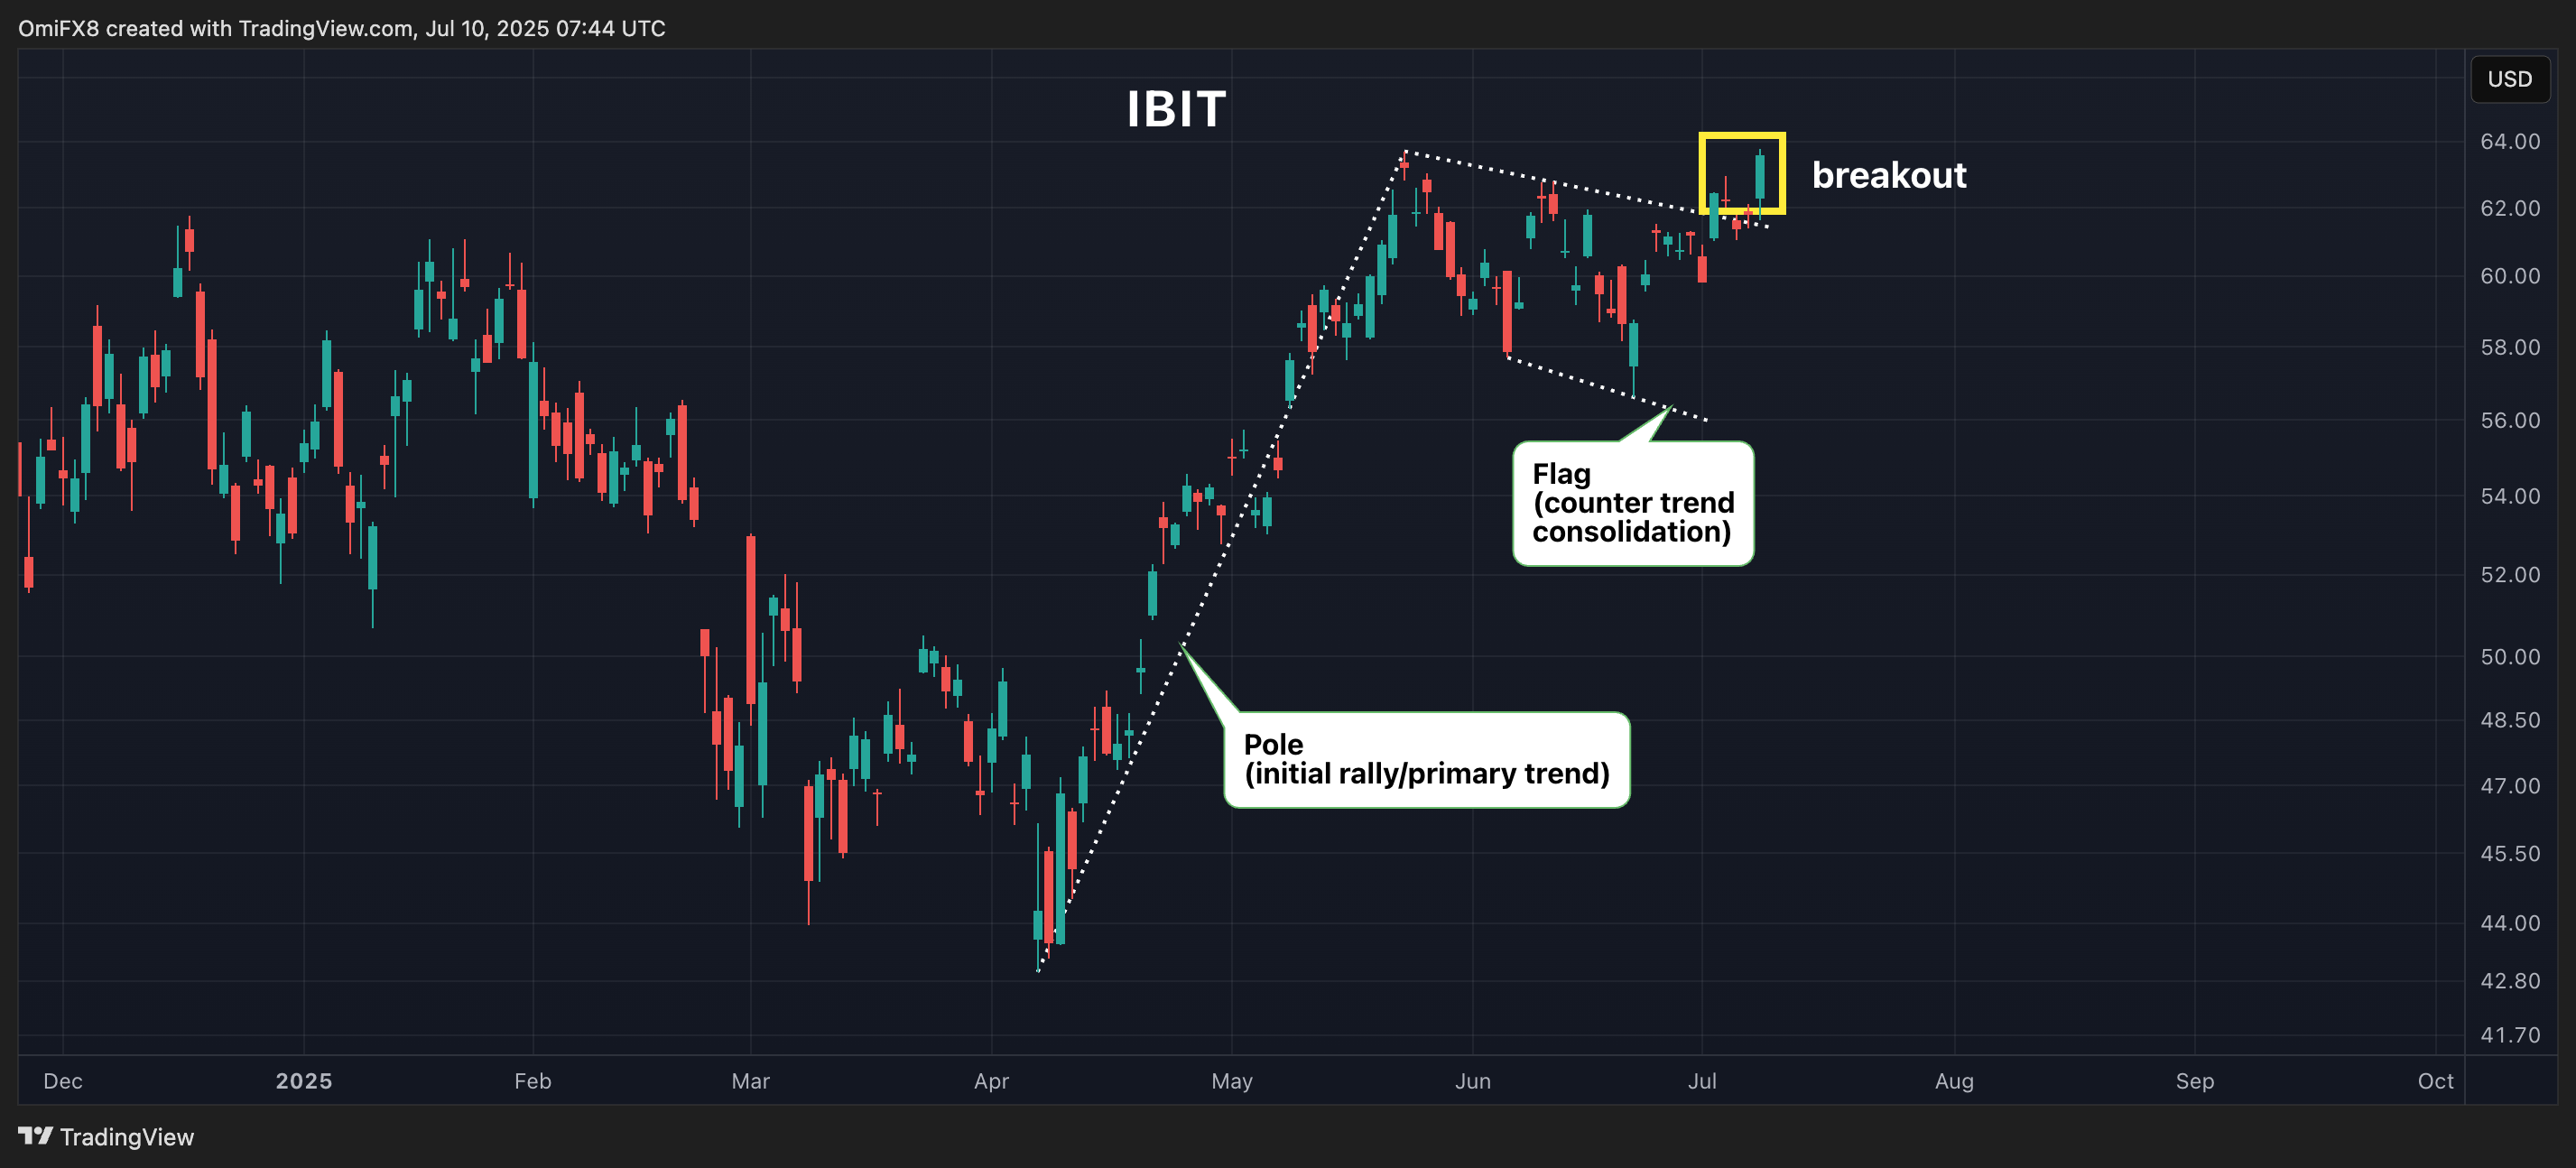
Flags have a low failure rate, according to technical analysis theory. That said, the pattern could fail if macro factors take a turn for the worse, pushing prices back into a counter-trend consolidation. Such a move WOULD negate the bullish outlook.
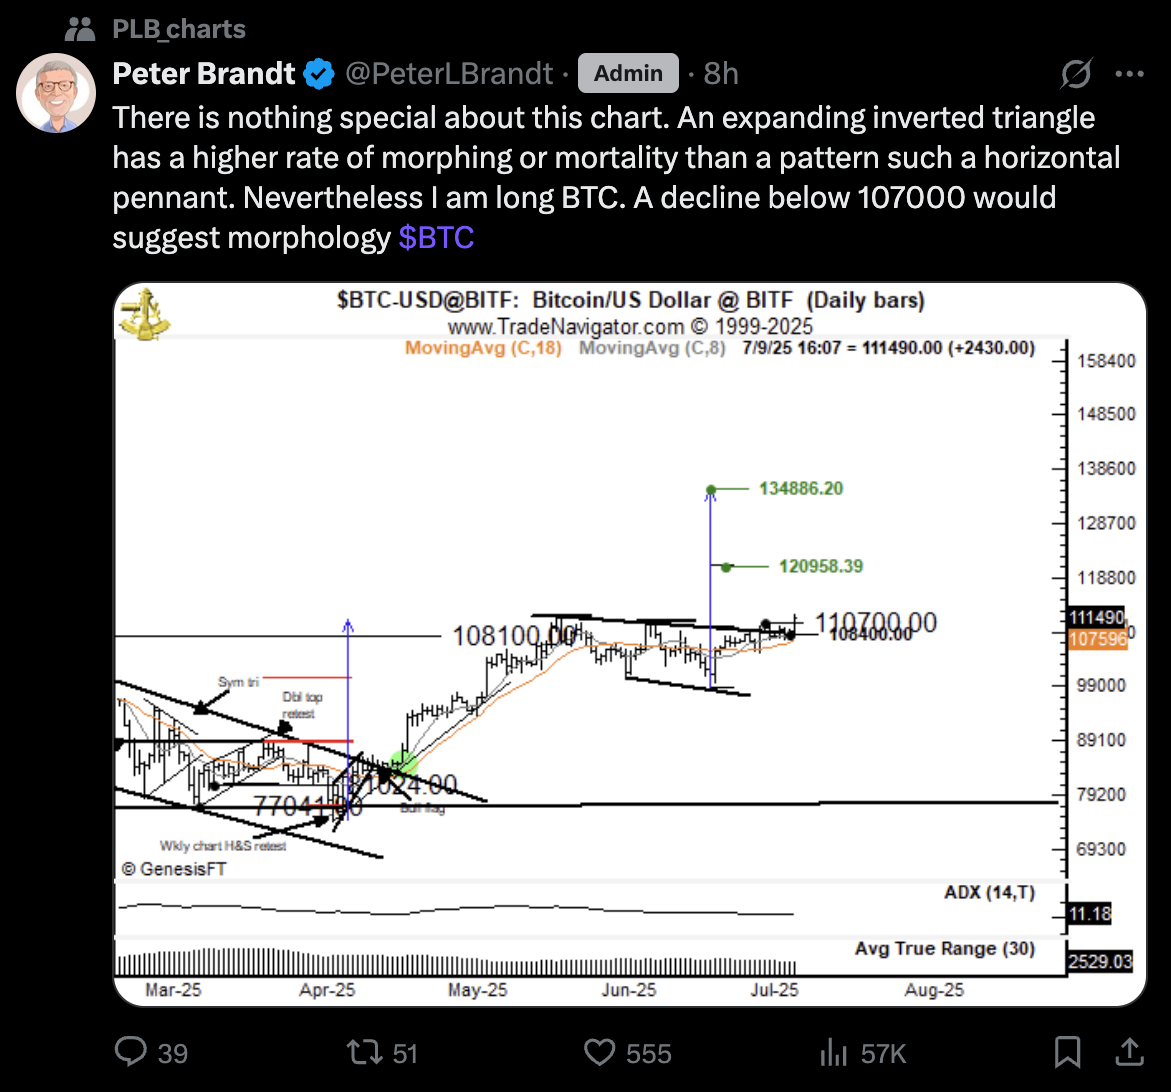
As of now, bitcoin's spot price also indicates a bullish setup, suggesting a potential rally to $134,000, according to veteran chart analyst Peter Brandt.