Bitcoin’s Next Bull Run: Will It Smash $115K or Rocket Past $223K?

The crypto markets are buzzing with anticipation—Bitcoin's next bull run could rewrite the rules. Two numbers dominate the conversation: $115K and $223K. Which one becomes reality?
Breaking Down the Targets
Analysts are split. Some see $115K as the logical resistance point, while others argue macro conditions could propel BTC to uncharted territory. The debate hinges on adoption, institutional inflows, and whether Wall Street finally gets its act together.
The Cynic's Corner
Let's be real—if traditional finance could've predicted Bitcoin's moves, they wouldn't be stuck charging 2% management fees for underperforming index funds. Crypto doesn't wait for permission.
One thing's certain: volatility's coming. Buckle up.
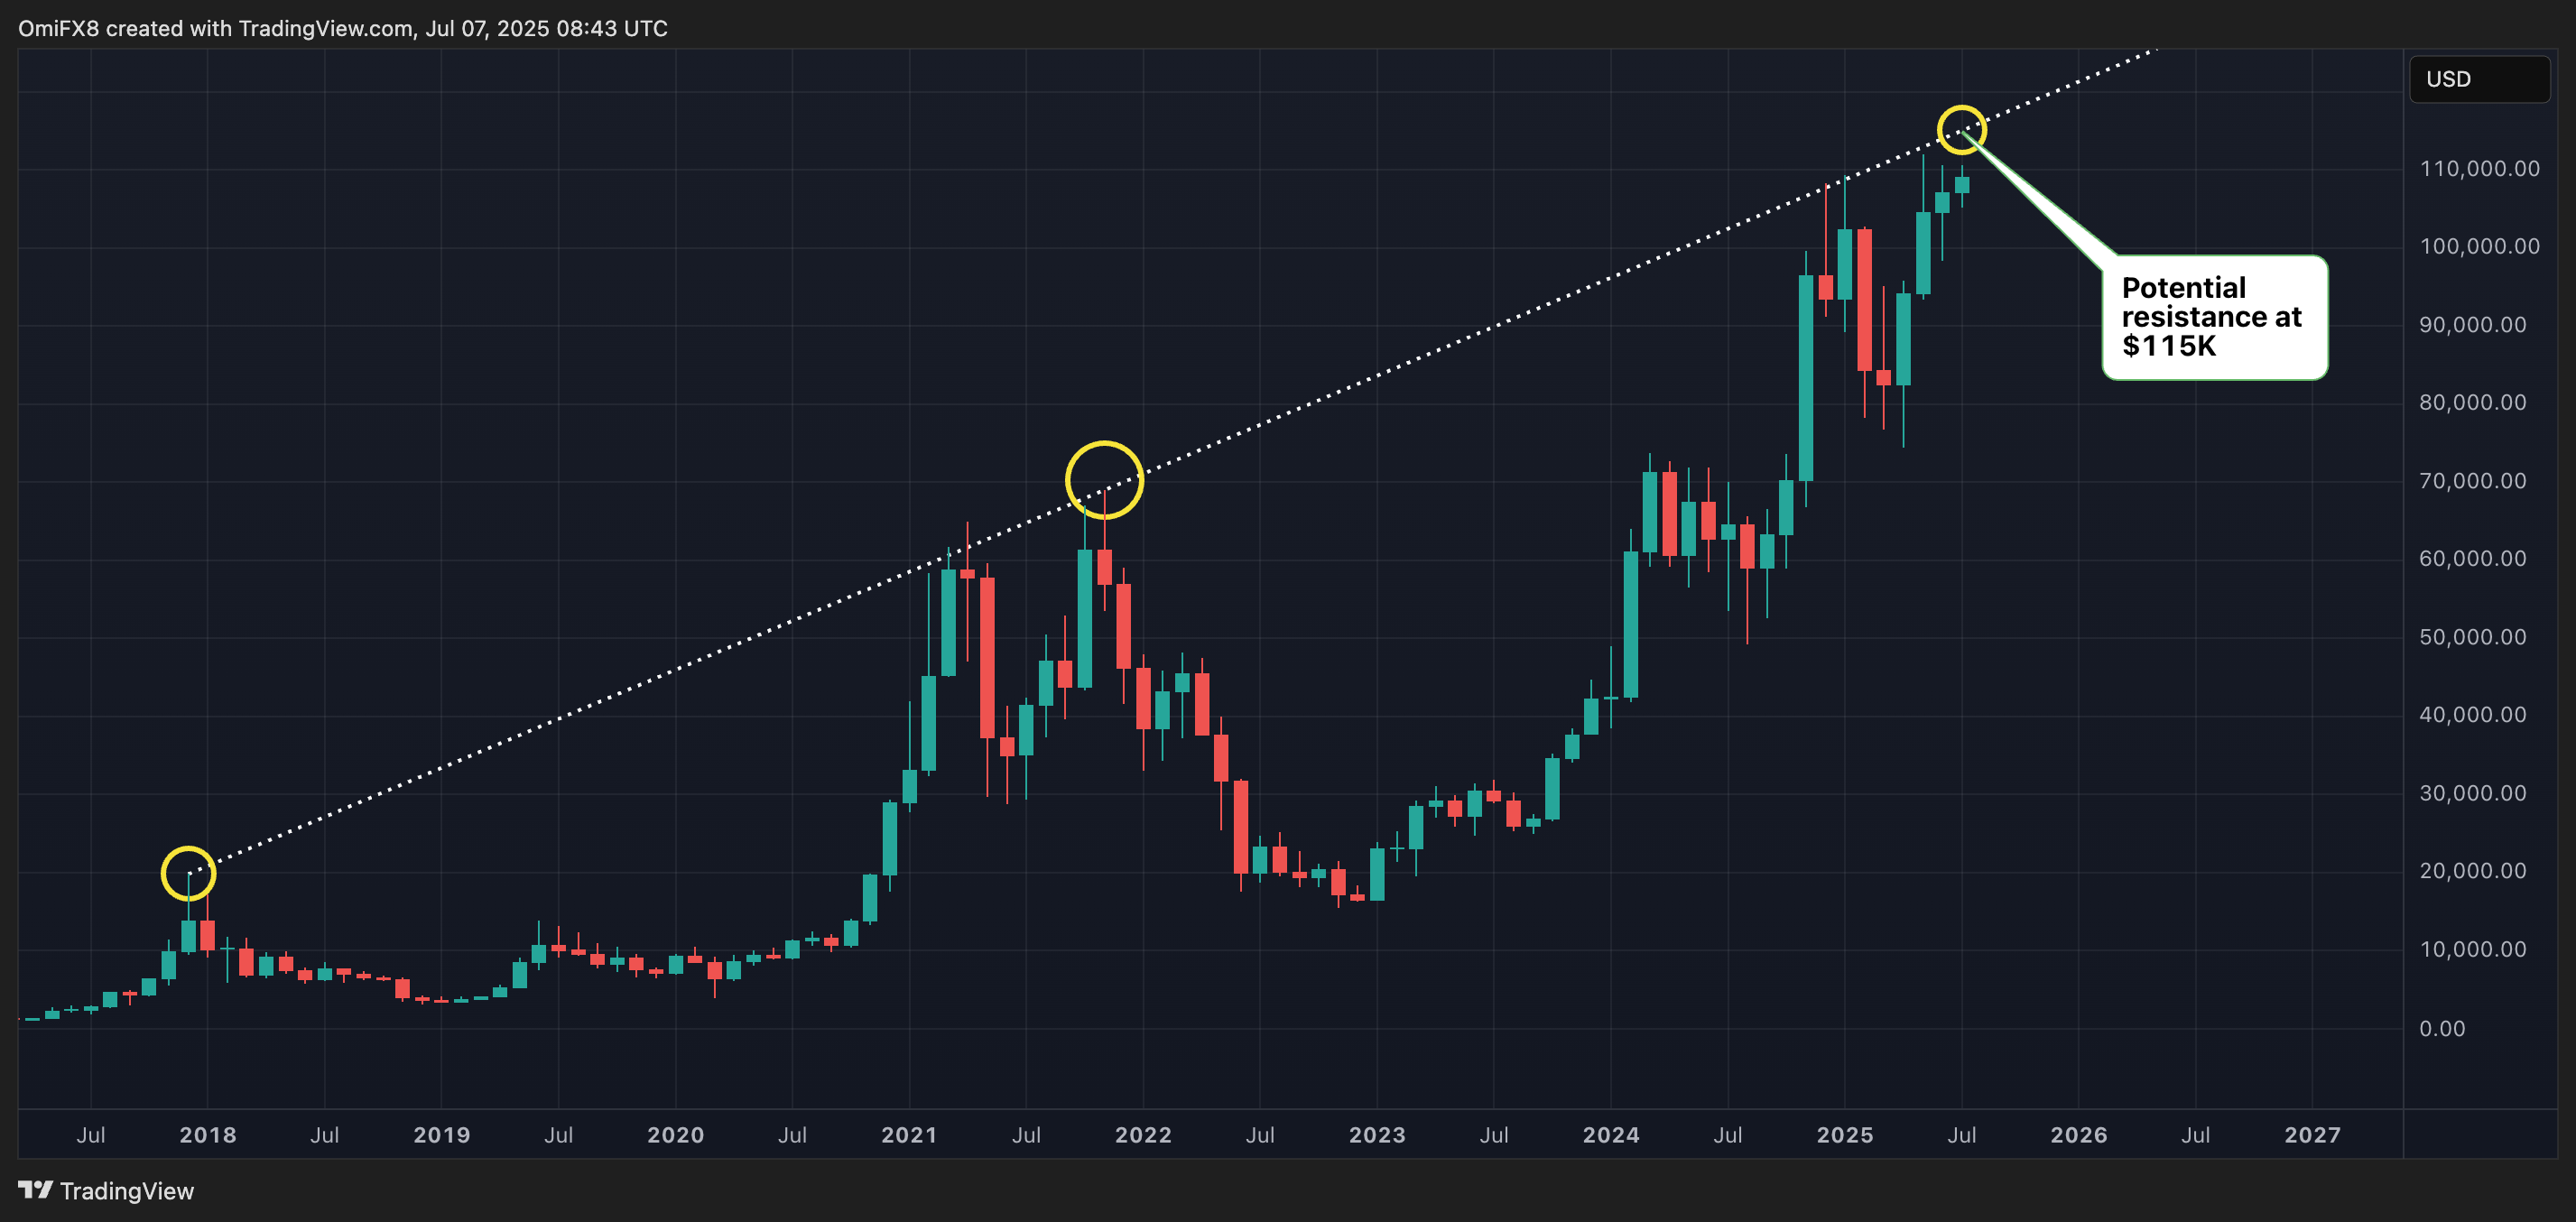
The same trendline capped upside in December and January, paving the way for a correction that saw prices drop to a low of $75,000 in April.
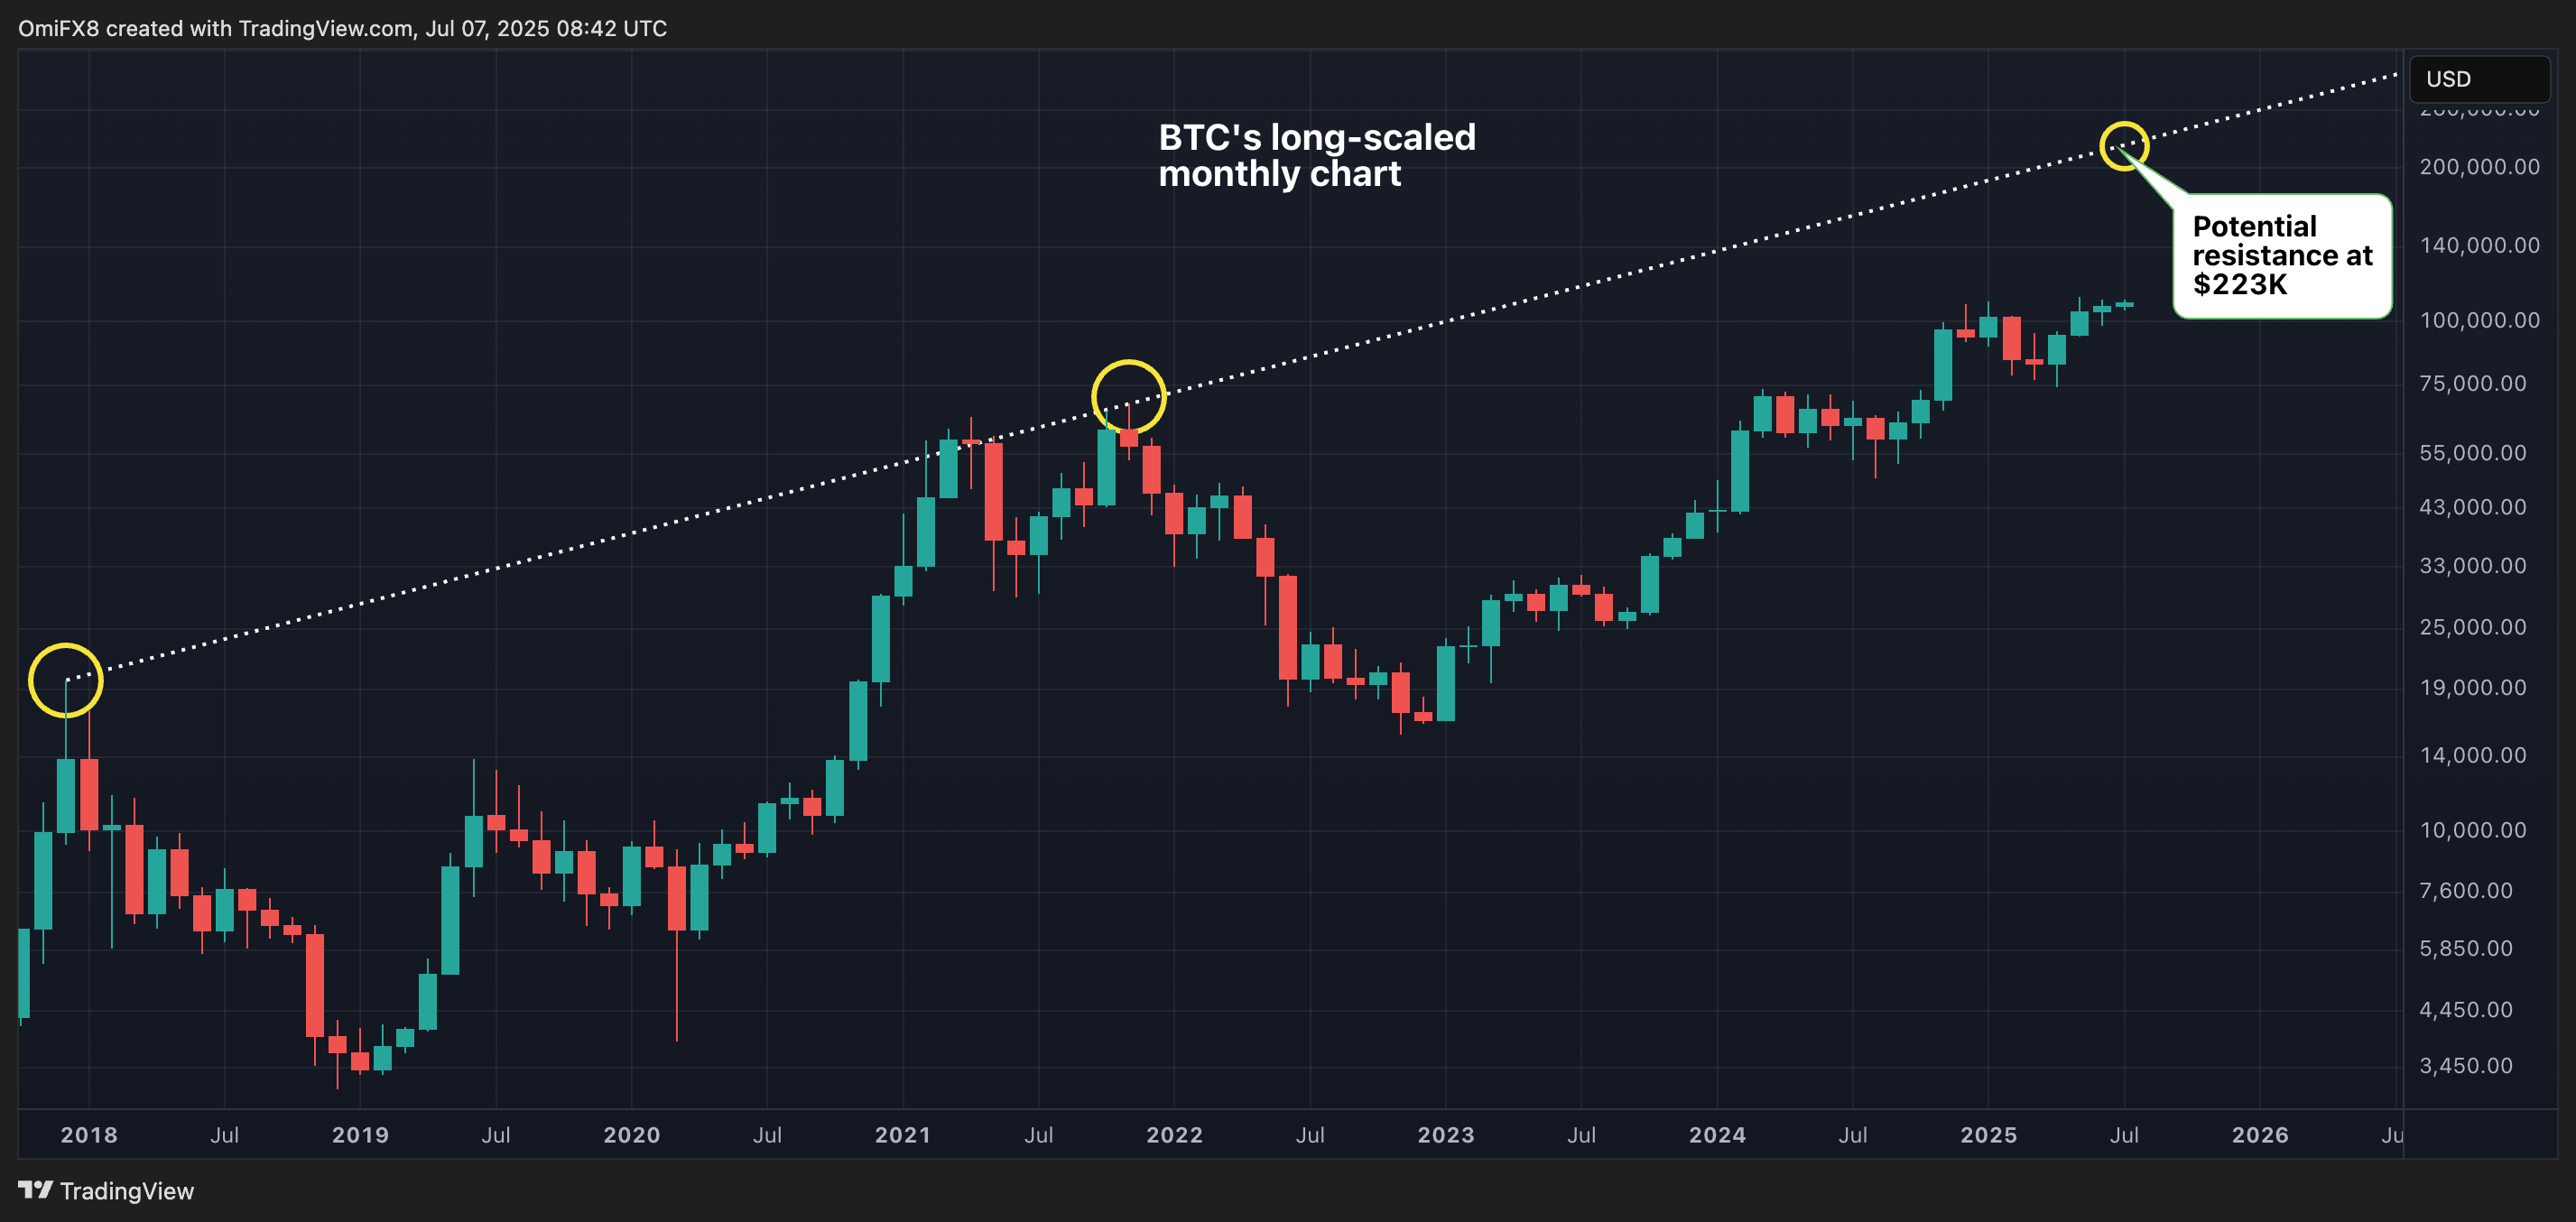
Log-scaled resistance at $220K
That said, the above chart is a linear-scaled or arithmetic-scaled monthly chart. It shows the absolute price changes, a feature that makes it suitable for analyzing short-term trends.
The potential resistance price, however, may be less reliable than that derived from the long-scaled chart, which compresses significant percentage moves, making trendlines and resistance levels more precise and more meaningful.
Connecting the 2017 and 2021 highs on the log-scaled monthly chart aligns the resistance at approximately $223,000, rather than $115,000. The log-scaled trendline resistance is likely more consistent with the exponential growth pattern of bitcoin's past bull markets.