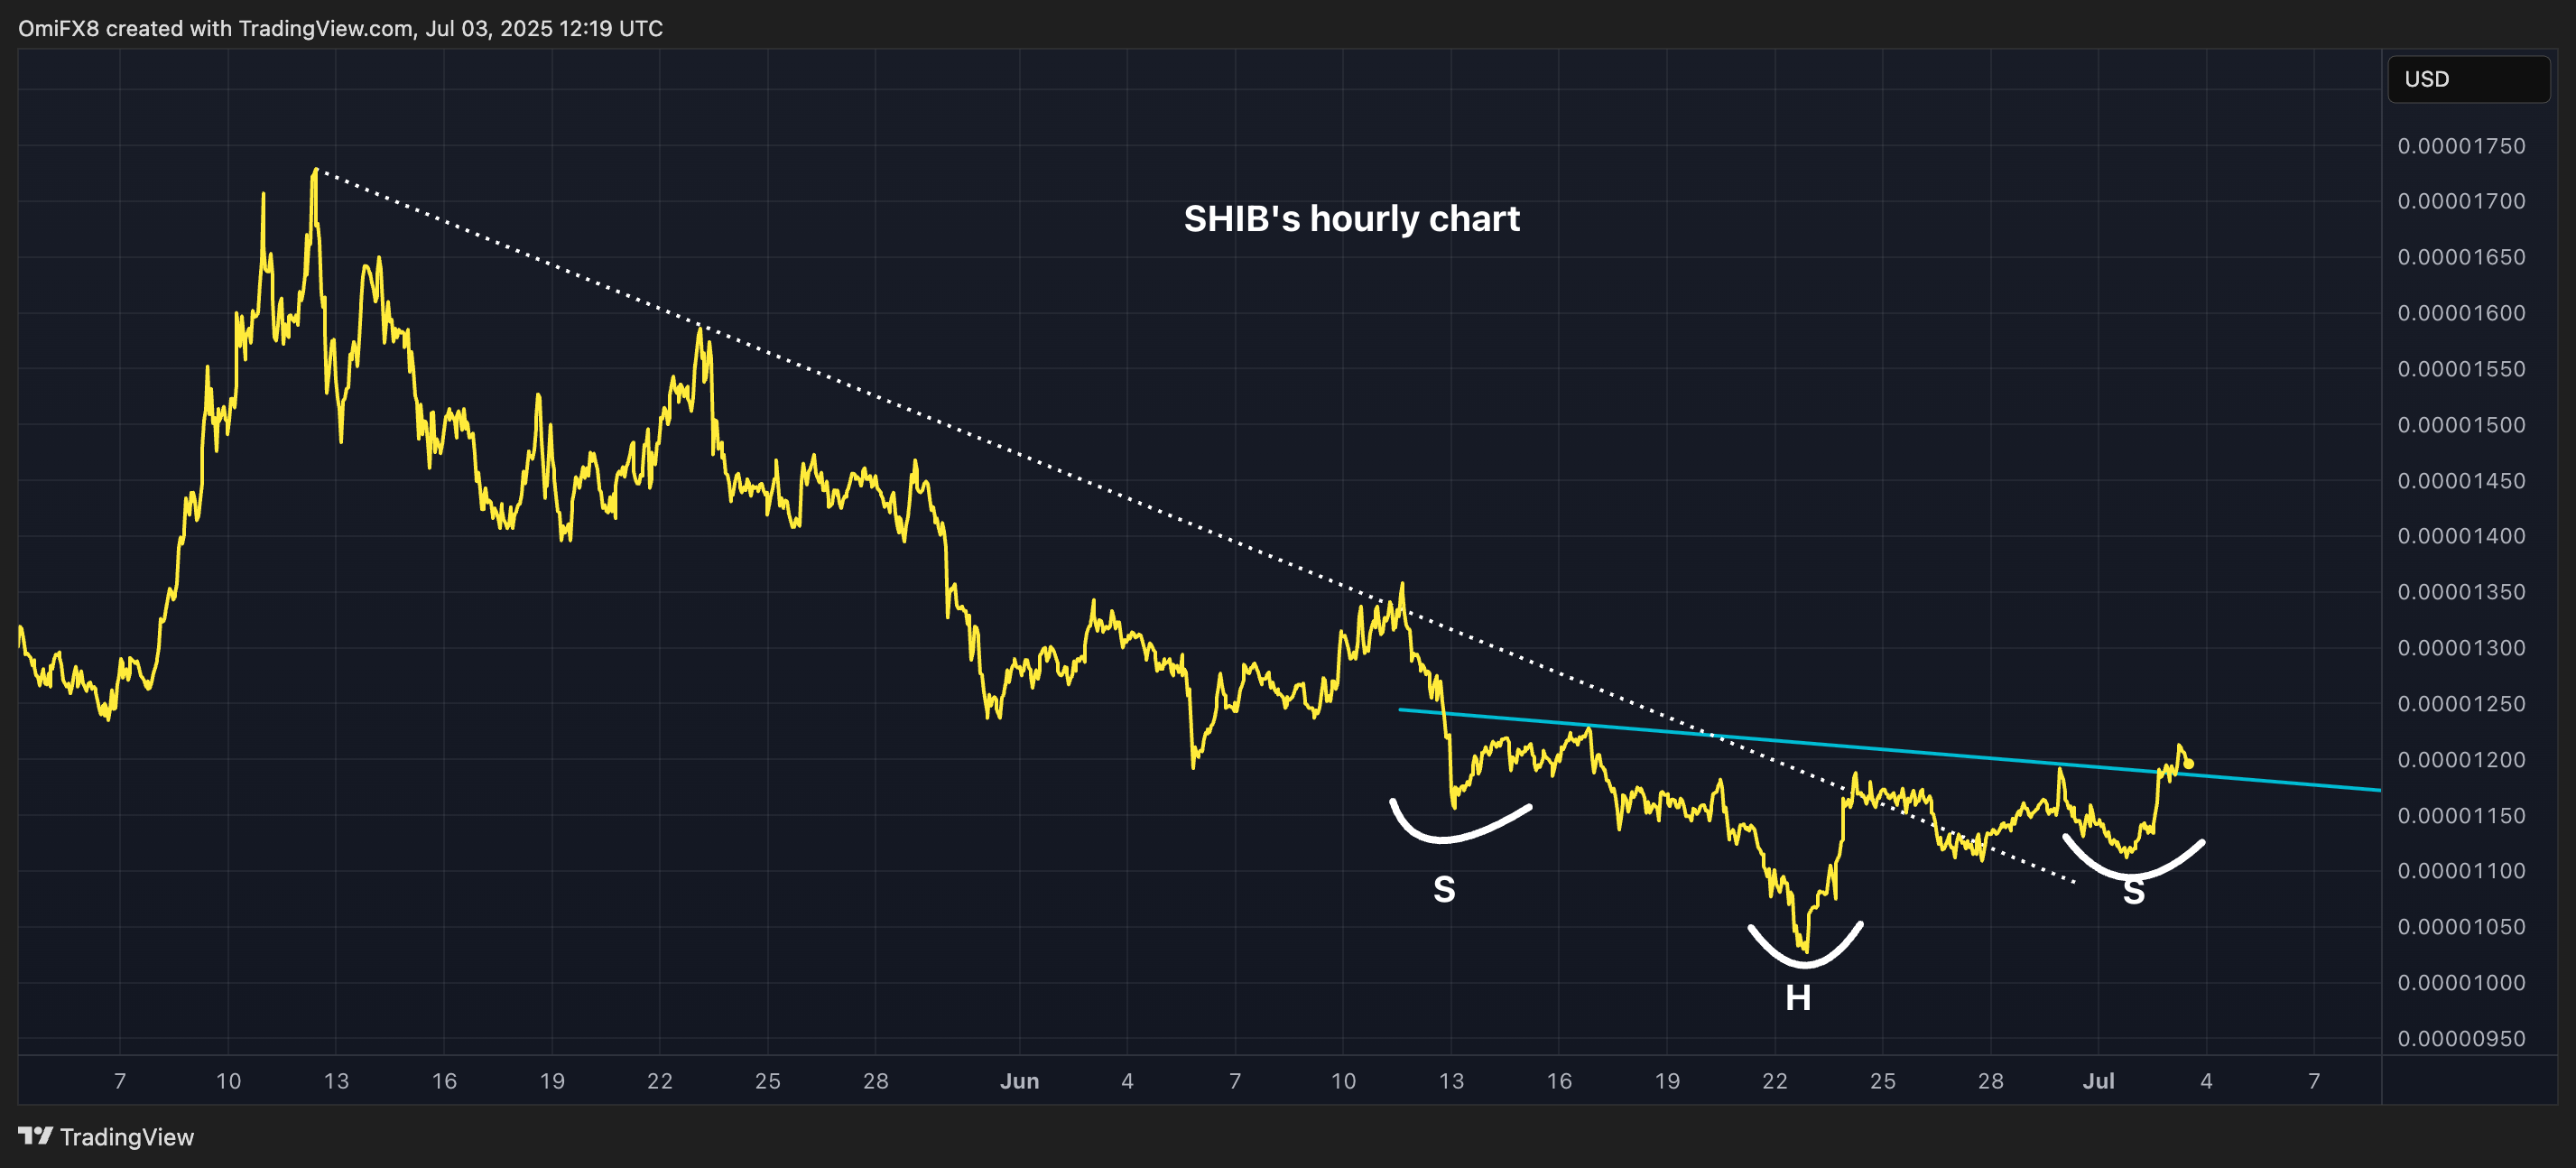
🚀 Shiba Inu Paints Bullish Inverse H&S Pattern as BONK Rides ETF Hype—1M Holders Locked In

Shiba Inu’s chart flashes a textbook inverse head-and-shoulders—the kind of setup that makes traders whisper 'bull run.' Meanwhile, BONK basks in ETF speculation glow, because nothing screams legitimacy like Wall Street’s stamp of approval.
And let’s not overlook the 1 million holder milestone—because in crypto, community size is the new fundamentals. Just don’t ask about utility.
Cynical finance jab: If memecoins keep getting ETFs, we’ll soon have a Dogecoin futures market predicting Elon’s next tweet.
Key AI insights
- SHIB demonstrated remarkable strength during the 24 hours from July 2, 12:00 to July 3, 11:00, climbing from $0.00001136 to $0.00001200, representing a 5.65% gain with a price range of $0.00000081.
- The token experienced a significant volume spike at 16:00 on July 2 (1.68B), establishing a high-volume support level at $0.00001162.
- The 24-hour volume profile confirms strong buyer interest, particularly during the European trading session.
- During the 60 minutes from 3 July 10:09 to 11:08, SHIB experienced notable volatility, initially trading at $0.00001204 before declining to $0.00001199, representing a 0.41% decrease.
- A significant volume spike occurred at 10:18 (15.01B), followed by an even larger spike at 11:04 (20.94B), coinciding with a price recovery from the session low of $0.00001195 at 10:50.
- The 5-hour period between 05:00 and 10:00 on July 3 saw sustained trading above $0.0000120, forming a new resistance zone.
BONK surges
BONK, a memecoin built on the Solana blockchain in late 2022, has surged 23% to $0.00001665 in the past 24 hours, becoming the best-performing top 100 cryptocurrency by market value.
According to CoinDesk's AI, the rally featured three distinct waves, with the most aggressive buying occurring between 23:00 and 01:00, when volume peaked at nearly 3 trillion units, establishing a high-volume support zone around $0.0000161.
The cryptocurrency also approached a one-million holder milestone. These bullish developments follow reports that Tuttle Capital’s proposed 2x Long BONK ETF has taken a procedural step forward.
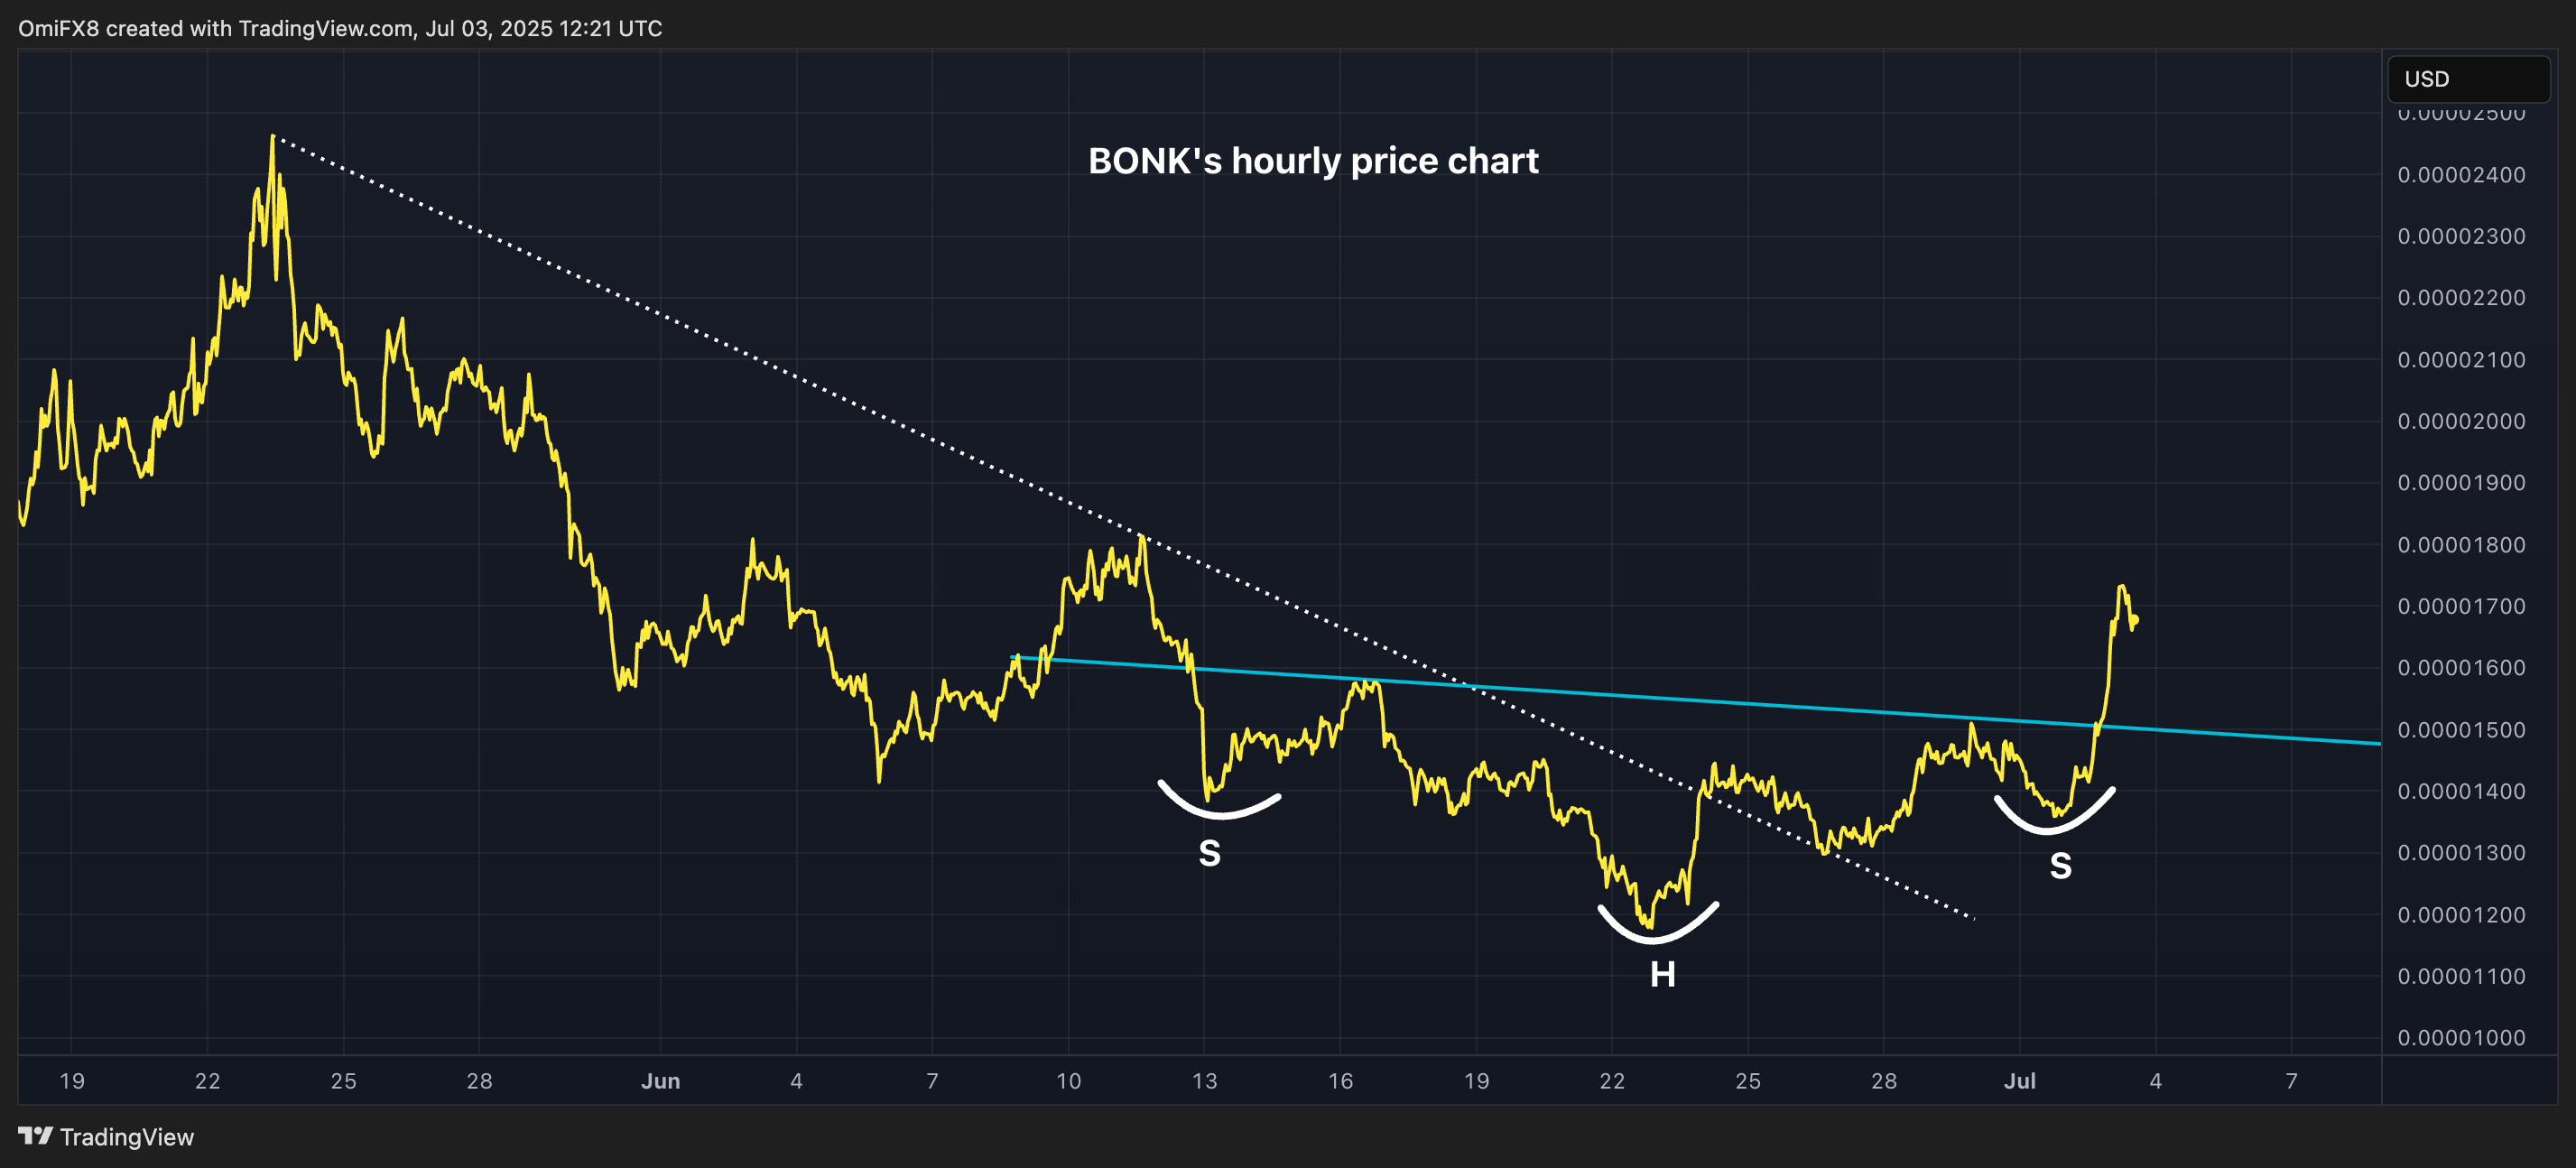
Speaking of technical analysis, BONK's hourly price chart displays a SHIB-like inverse head-and-shoulders bullish reversal pattern.
Key AI insights
- BONK-USD demonstrated remarkable strength over the 24 hours from 2 July 12:00 to 3 July 11:00, surging from $0.0000142 to $0.0000167, representing a 17% gain.
- A significant price range of $0.00000345 (24%) was observed, with strong volume-supported resistance at the $0.0000174 level during the 5:00 hour on July 3rd.
- During the 60 minutes from July 3, 10:34 to 11:33, BONK-USD experienced significant volatility, declining 1.35% from $0.00001689 to $0.00001667.
- A notable sell-off occurred at 10:42 when the price dropped 7.6% amid peak volume of 95.9 billion units.
