Bitcoin Smashes 50-Day Average Record—Just as Traders Start Sweating

Bitcoin's 50-day moving average just notched an all-time high—the kind of milestone that usually sends crypto bros popping champagne. But this time? The charts are flashing amber.
Pricey momentum meets shaky demand
That golden cross looks less shiny when you spot institutional inflows stalling faster than a DeFi rug pull. Even the most diamond-handed HODLers are side-eyeing leveraged positions.
Wall Street's playing both sides
Meanwhile, traditional finance vultures are circling—half writing 'told-you-so' thinkpieces, half quietly accumulating BTC ETFs like digital Scrooge McDucks. Classic hedge fund hypocrisy.
One immutable truth remains: the market always finds new ways to humble bulls and bears alike. Just ask the 'stablecoin yield farmers' from last cycle.
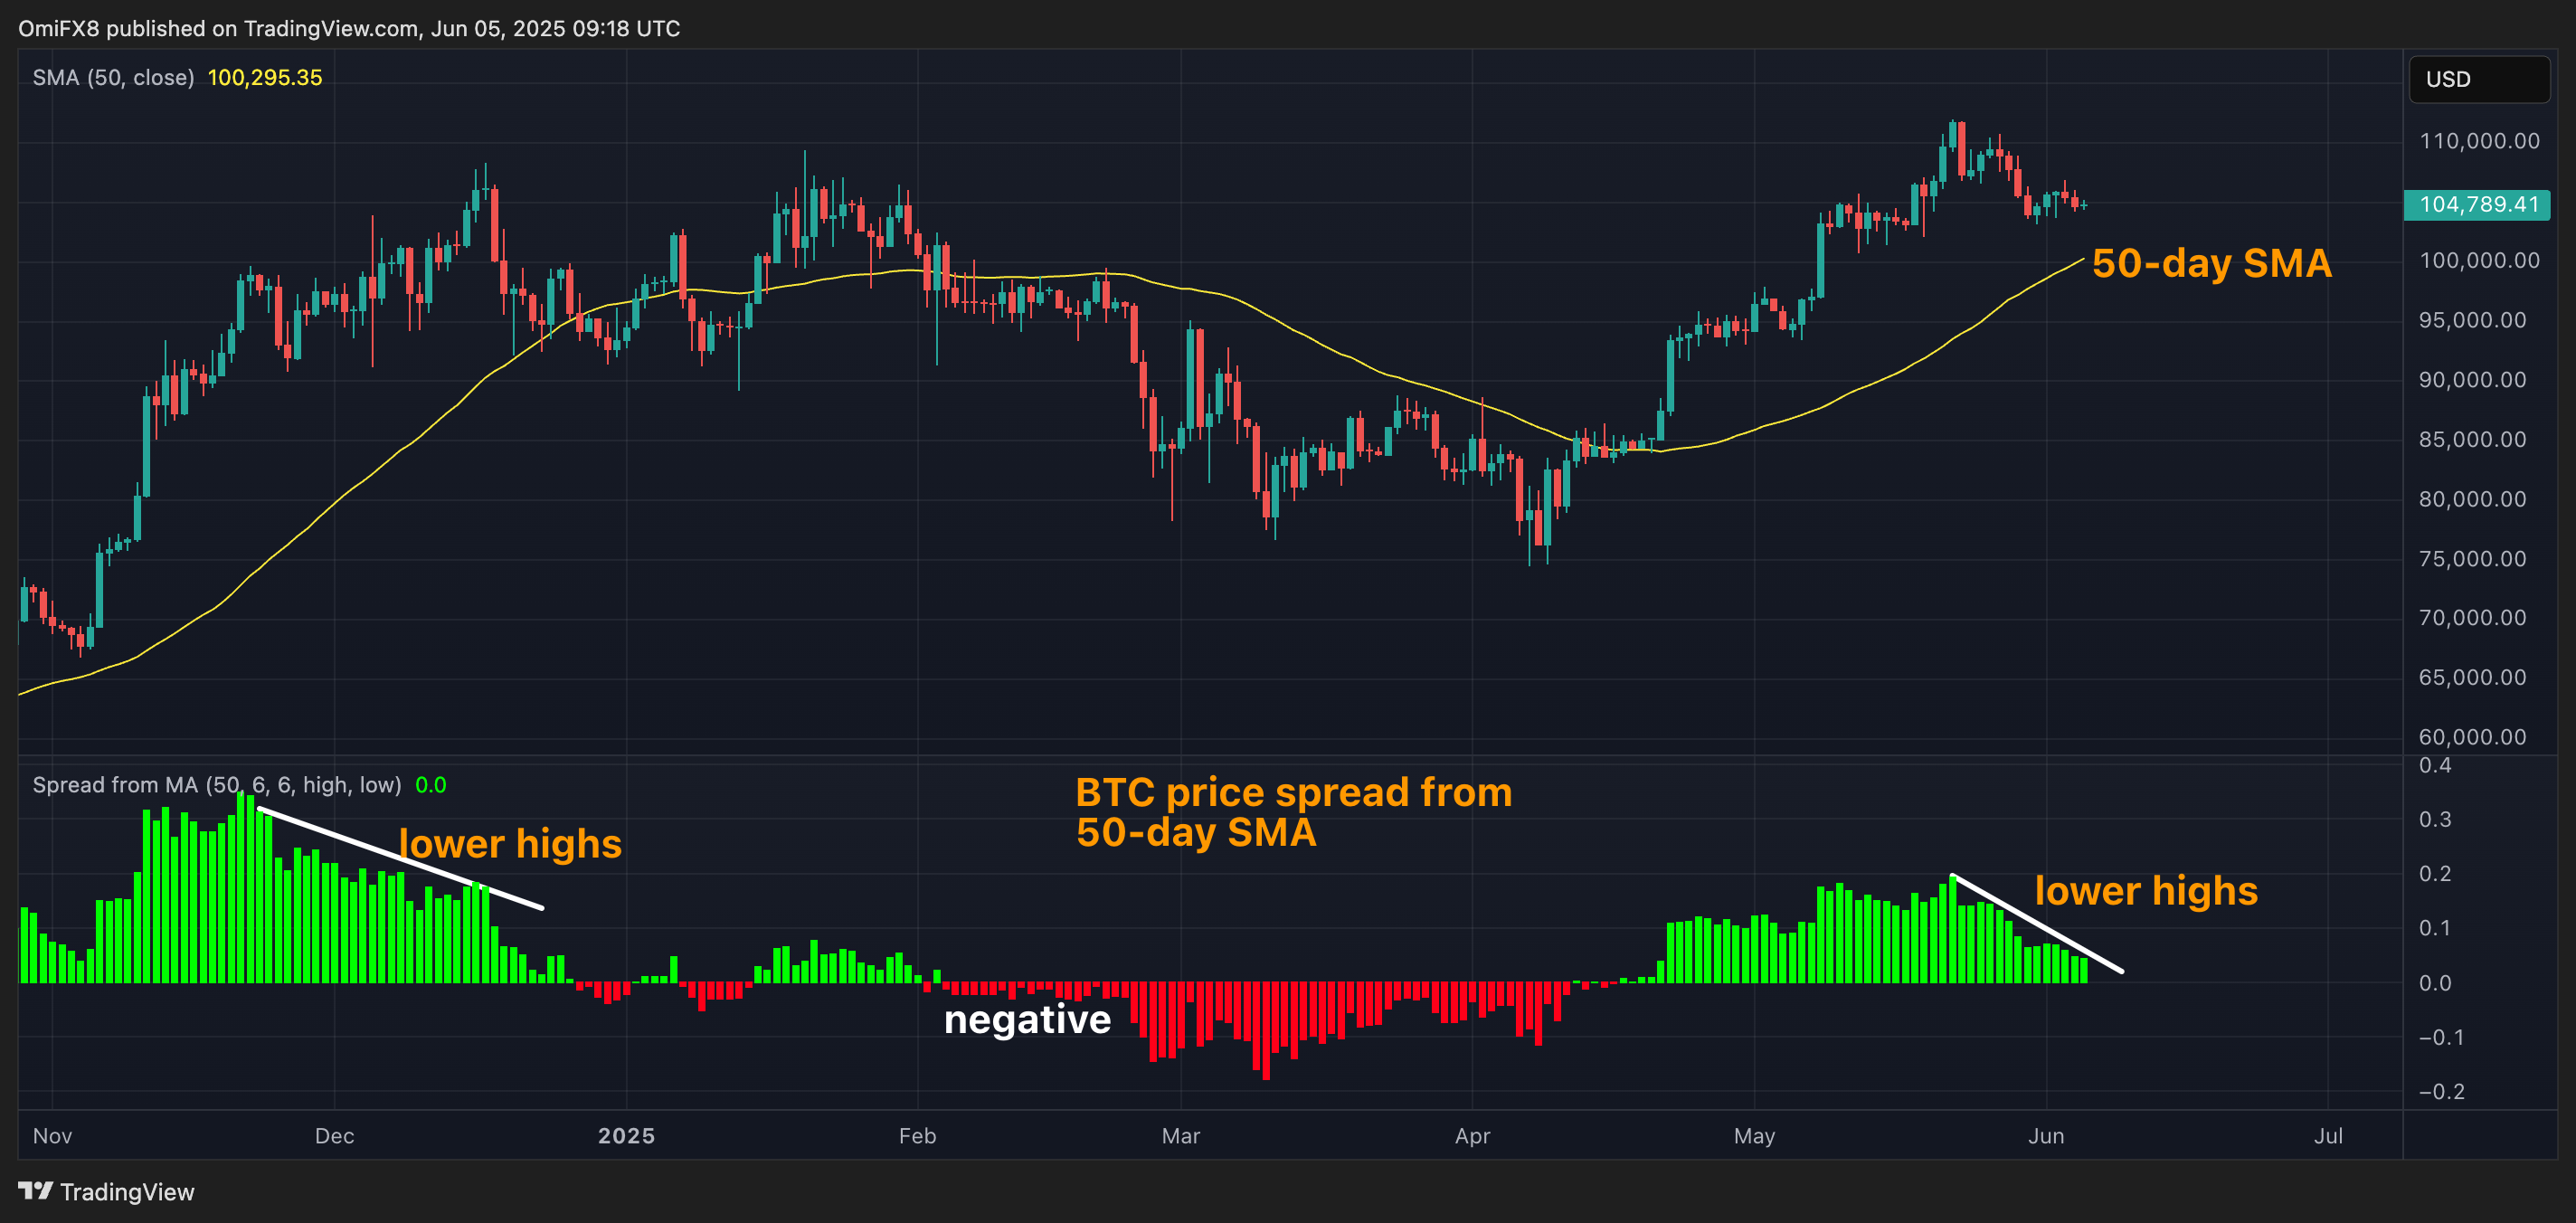
The lower pane on the chart shows the difference between the spot price and the 50-day SMA. Positive and rising values suggest strengthening upward momentum, while negative values suggest the opposite.
The spread, though positive, has been narrowing since May 22, indicating a weakening of the bull momentum. A potential correction could find support of the 50-day SMA at $100,295.
A similar pattern was observed through December, marking uptrend exhaustion above $100,000. The spread eventually flipped negative in February, presaging a multiweek sell-off to $75,000.
