Bitcoin Stalls Below ATH—But On-Chain Data Hints at Imminent Breakout

Bitcoin’s price action looks shaky as it wobbles below all-time highs—yet ’realized price’ metrics tell a different story. Here’s why traders are quietly stacking sats despite the sideways movement.
The Realized Price Signal: Why This Dip Isn’t Like the Others
While traditional finance pundits hyperventilate over short-term volatility (between sips of their $8 artisan lattes), on-chain analysis shows long-term holders refuse to panic-sell. The realized price—essentially the average cost basis of all coins—now acts as a springboard rather than resistance.
Greed vs. Gravity: What Comes Next
Every ’overbought’ RSI reading gets met with furious buy pressure from institutions still under-allocated. Call it the FOMO of the financially obsolete—legacy money managers finally realizing their Excel models can’t price network effects.
So is this consolidation the calm before the storm? The charts scream ’yes.’ But then again, Wall Street analysts still think ’HODL’ is a typo.
Historical Context: Capitulation Patterns
Historically, when price falls below a cohort’s realized price, it often marks market capitulation and cyclical bottoms:
- 2024: After the ETF launch in January, bitcoin dipped below the average cost basis before rebounding. A more significant capitulation followed in the summer, linked to the yen carry trade unwind when bitcoin plunged to $49,000.
- 2023: Price tracked close to the average cost basis during support levels, only briefly breaking below during the Silicon Valley Bank crisis in March.
The data suggests that a capitulation phase has likely occurred, positioning the market for a more constructive phase. Historically, recoveries from such events mark transitions into healthier market conditions.
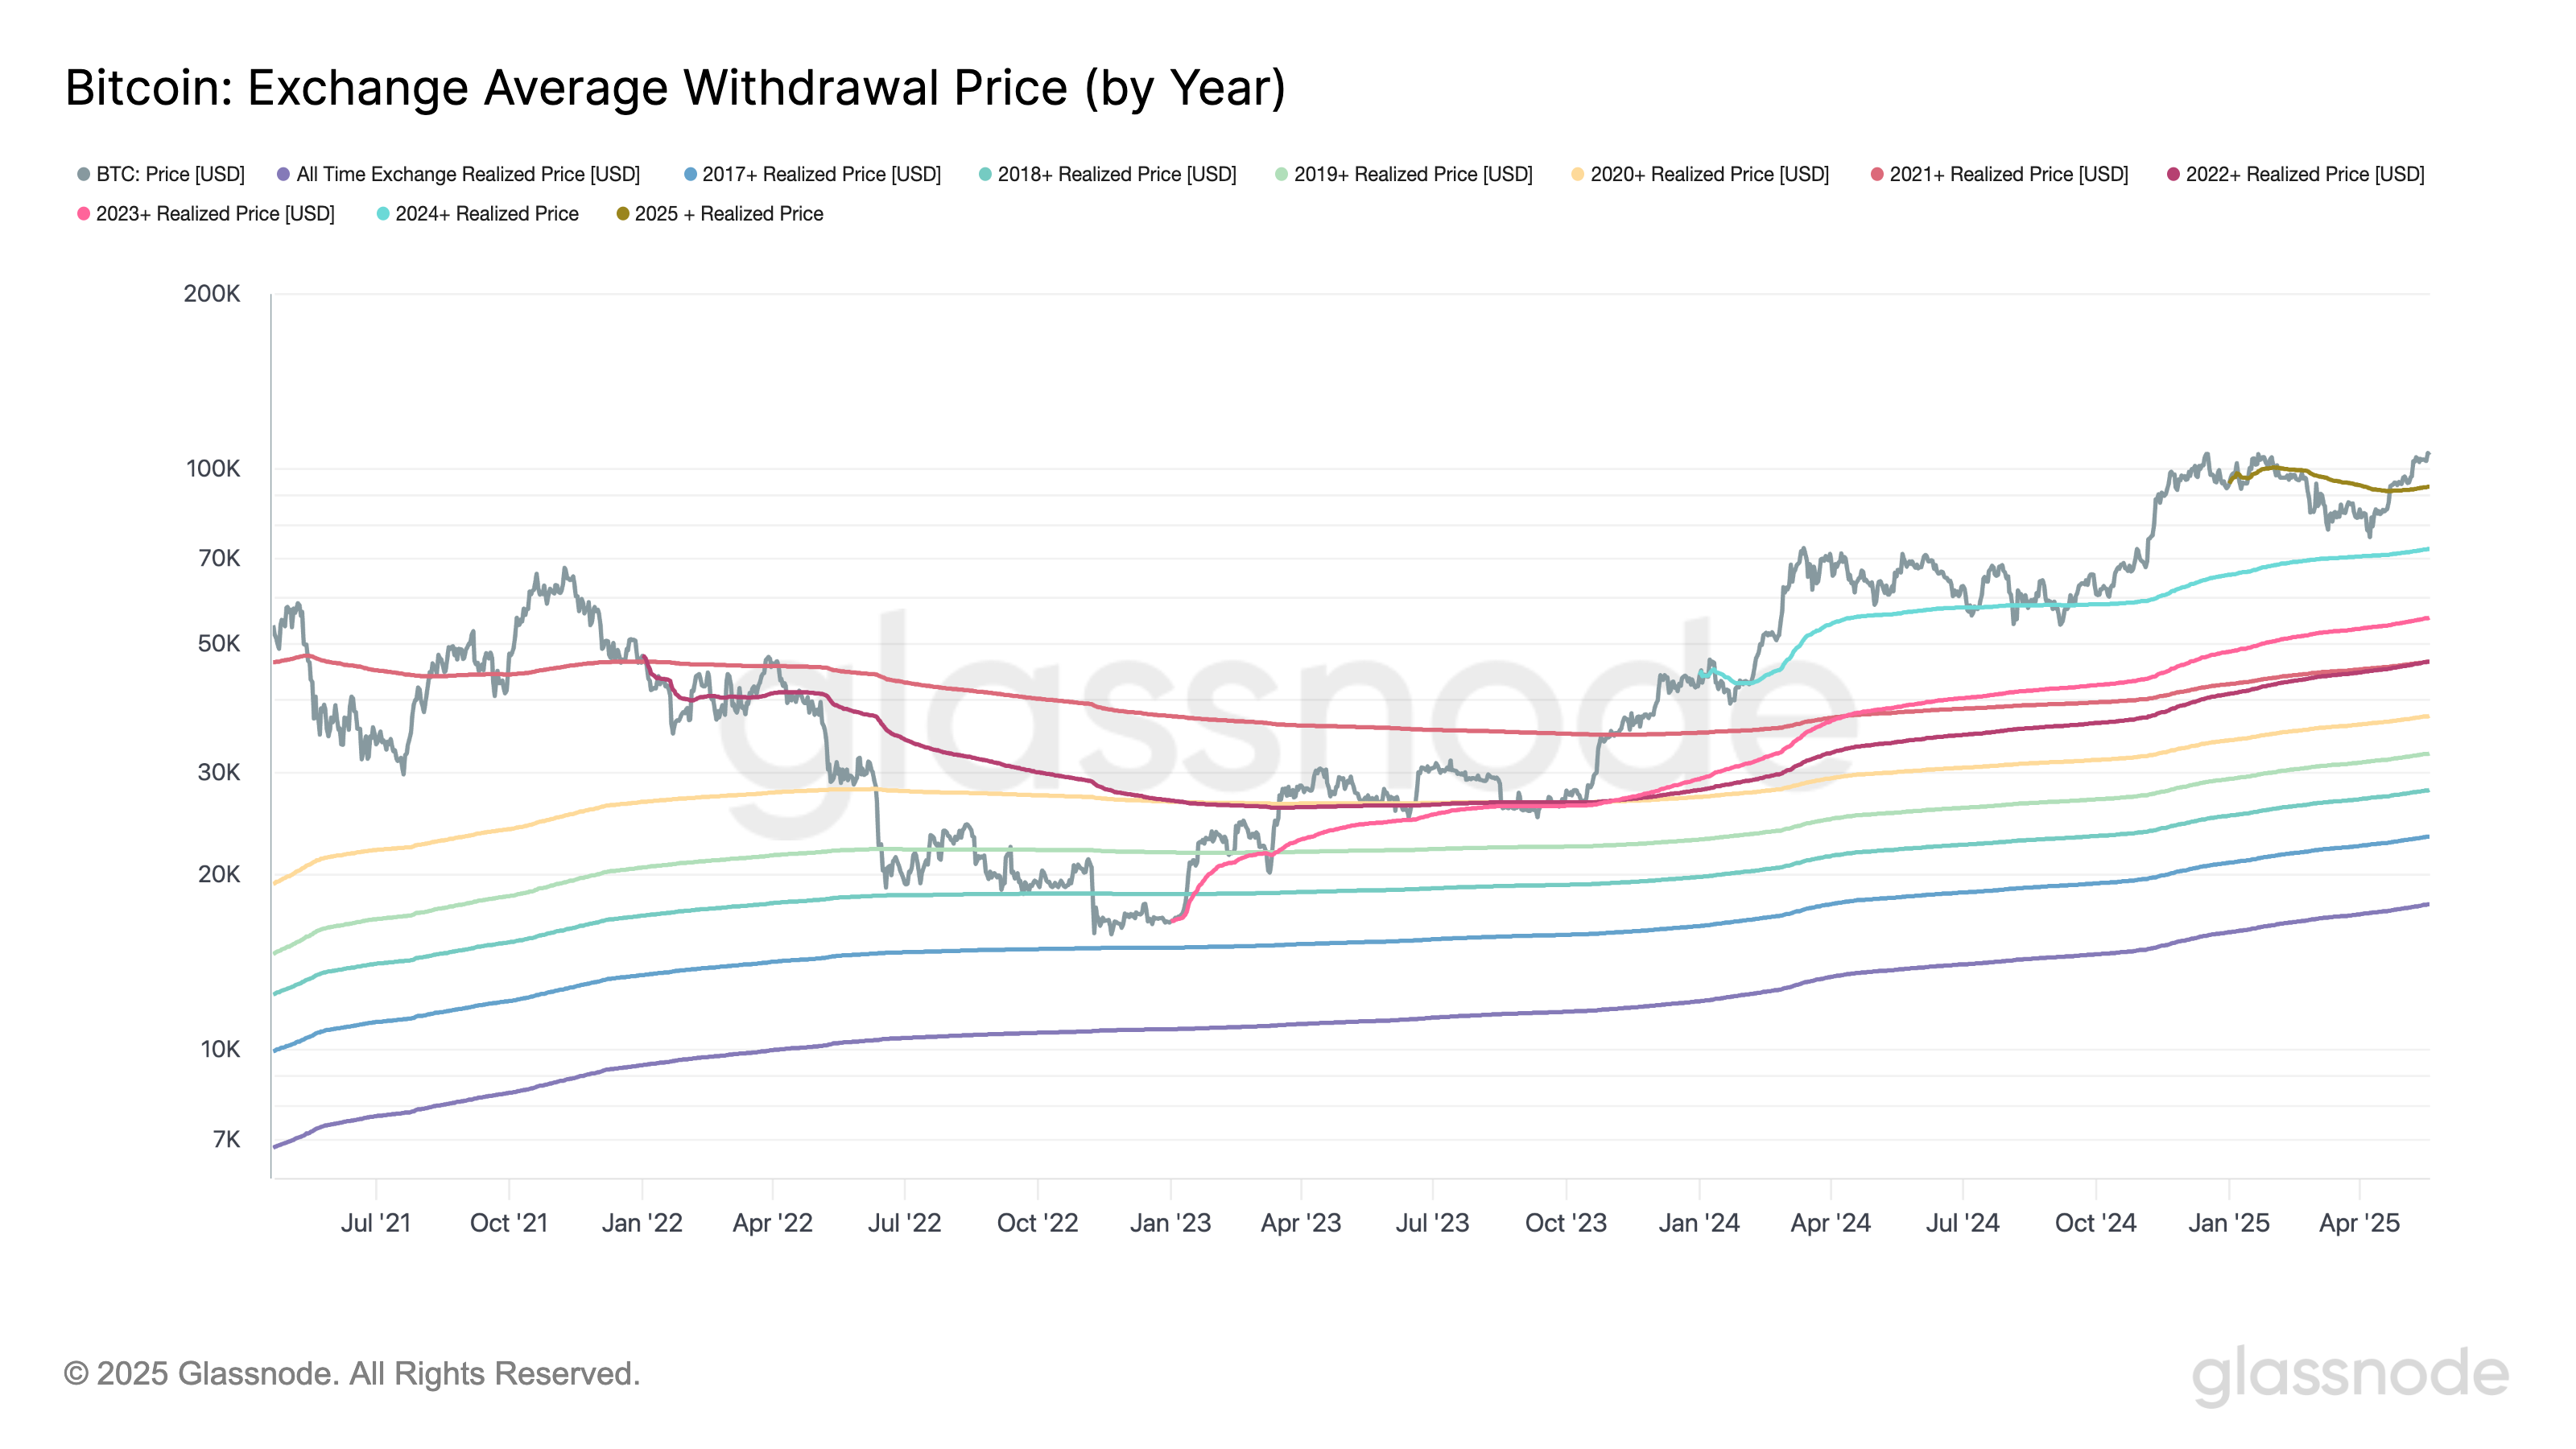
When bitcoin first surpassed $20,000 during the 2017 bull market, it marked a significant divergence between the market price and the realized price of just $5,149, highlighting a phase of exuberant speculation. Unsurprisingly, prices very shortly went into a brutal reversal.
In contrast, by the depths of the 2018 bear market when bitcoin bottomed around $3,200, price at that point converged with the all-time realized price, a metric that aggregates the cost basis of all investors across cycles.
This long-term cost basis acts as a foundational support level in bear markets and gradually rises over time as new capital enters the market. Therefore, evaluating bitcoin solely by comparing cycle peaks, for example, from $69,000 in 2021 to just over $100,000 in 2025, misses the bigger picture.
The more relevant insight is that the aggregate cost basis of all investors continues to climb, underscoring the long-term maturation of the asset and the increasing depth of capital committed to the network.
