Bitcoin’s Next Mega Rally? Two Chart Formations Echo Path to $109K

Bitcoin’s price action is flashing eerily familiar signals—two technical patterns now mirror its historic runs. Traders whisper of a potential replay, this time targeting six figures.
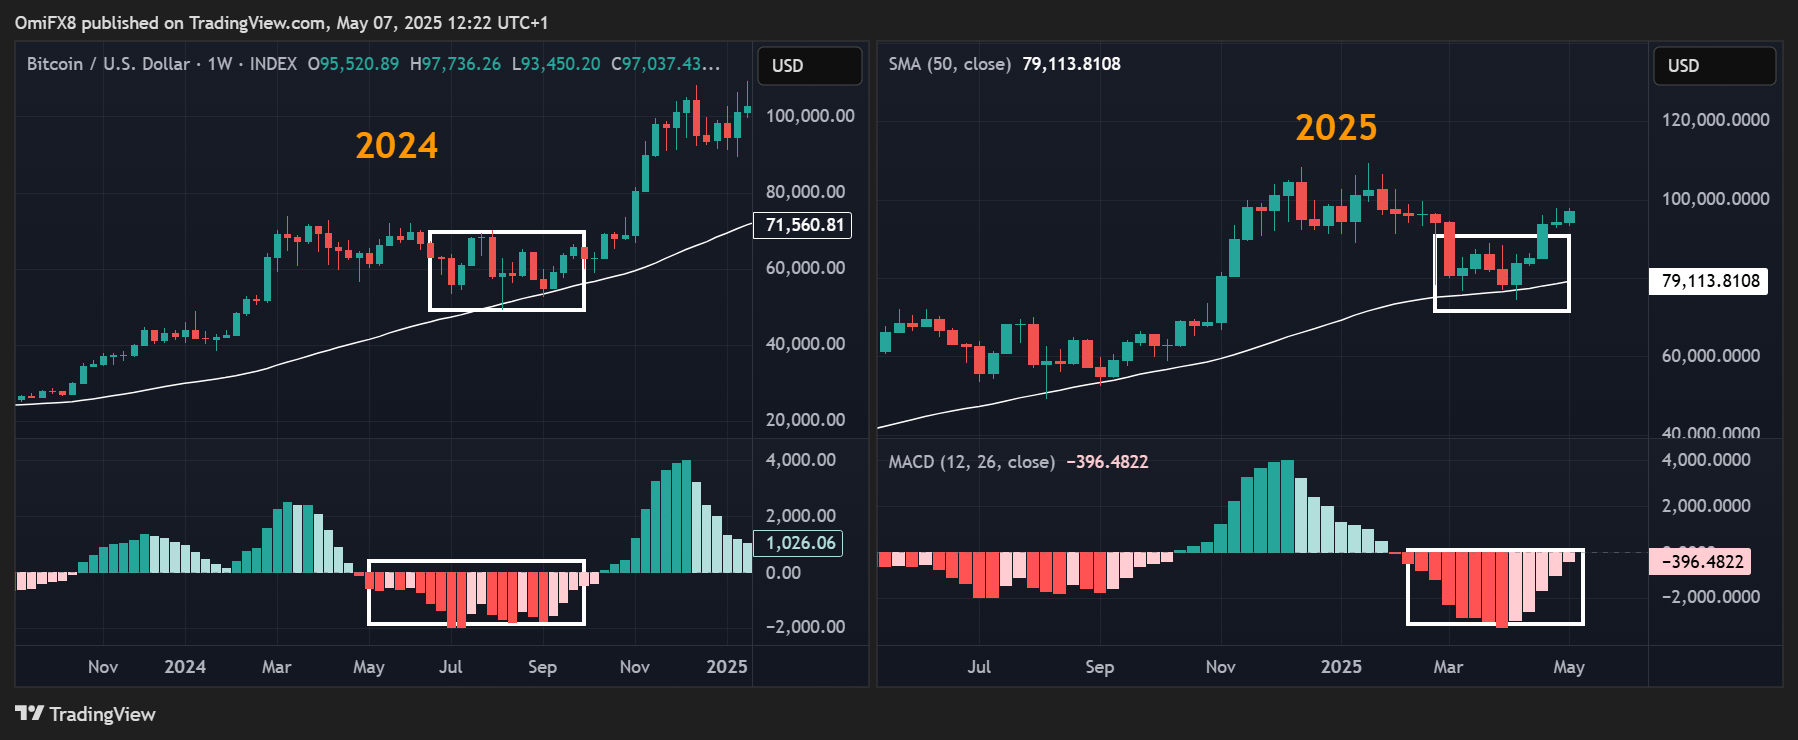
The setup: A bullish wedge breakout paired with a cup-and-handle formation, both previously seen before BTC’s most violent upside moves. History doesn’t repeat, but it often rhymes—especially when Wall Street ‘experts’ are busy downgrading crypto between martini lunches.
Key levels to watch? Hold $60K, and the path clears for a speculative frenzy toward $109K. Fail, and we’re back to the usual casino rules—just with more volatile chips.
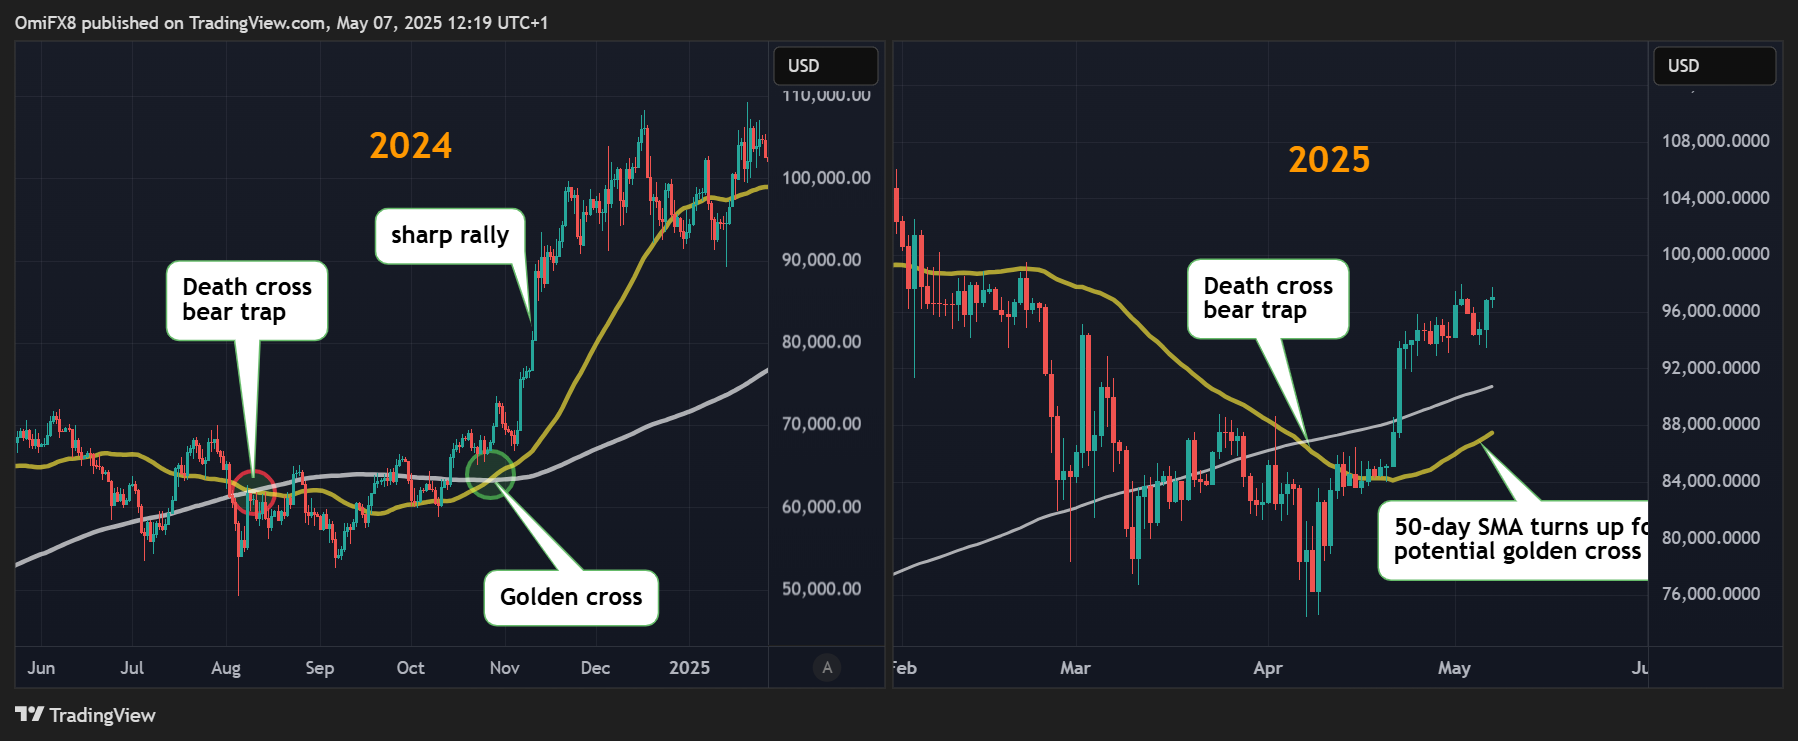
The second pattern involves the 50- and 200-day SMAs. About four weeks ago, these averages formed a bearish crossover—commonly known as the death cross—signaling a potential long-term downtrend. However, this turned out to be a bear trap, with Bitcoin finding support around $75K and reversing course.
Recently, the 50-day SMA has begun to rise again and could soon cross above the 200-day SMA, setting up a bullish golden cross in the coming weeks.
This pattern closely mirrors last year’s trend: the death cross in August marked a bottom, quickly followed by a golden cross that sparked a breakout above $70K and ultimately led to a rally above $109K to new highs.
In other words, bullish volatility could be on the horizon, potentially taking bitcoin well past the January high of $109K.
Chart patterns are commonly used to assess market strength and forecast future movements. However, it’s important to remember that history doesn’t always repeat itself, and macroeconomic factors can rapidly swing market directions, making chart analysis far from foolproof.

Log in to Reply
Log in to comment your thoughtsComments
Related Articles
|Square
Get the BTCC app to start your crypto journey
Get started today Scan to join our 100M+ users