XRP Exhibits Tight Consolidation Similar to a Coiled Spring, Signaling Potential for a Major Breakout as Critical Volatility Metrics Echo Early 2024 Behavior

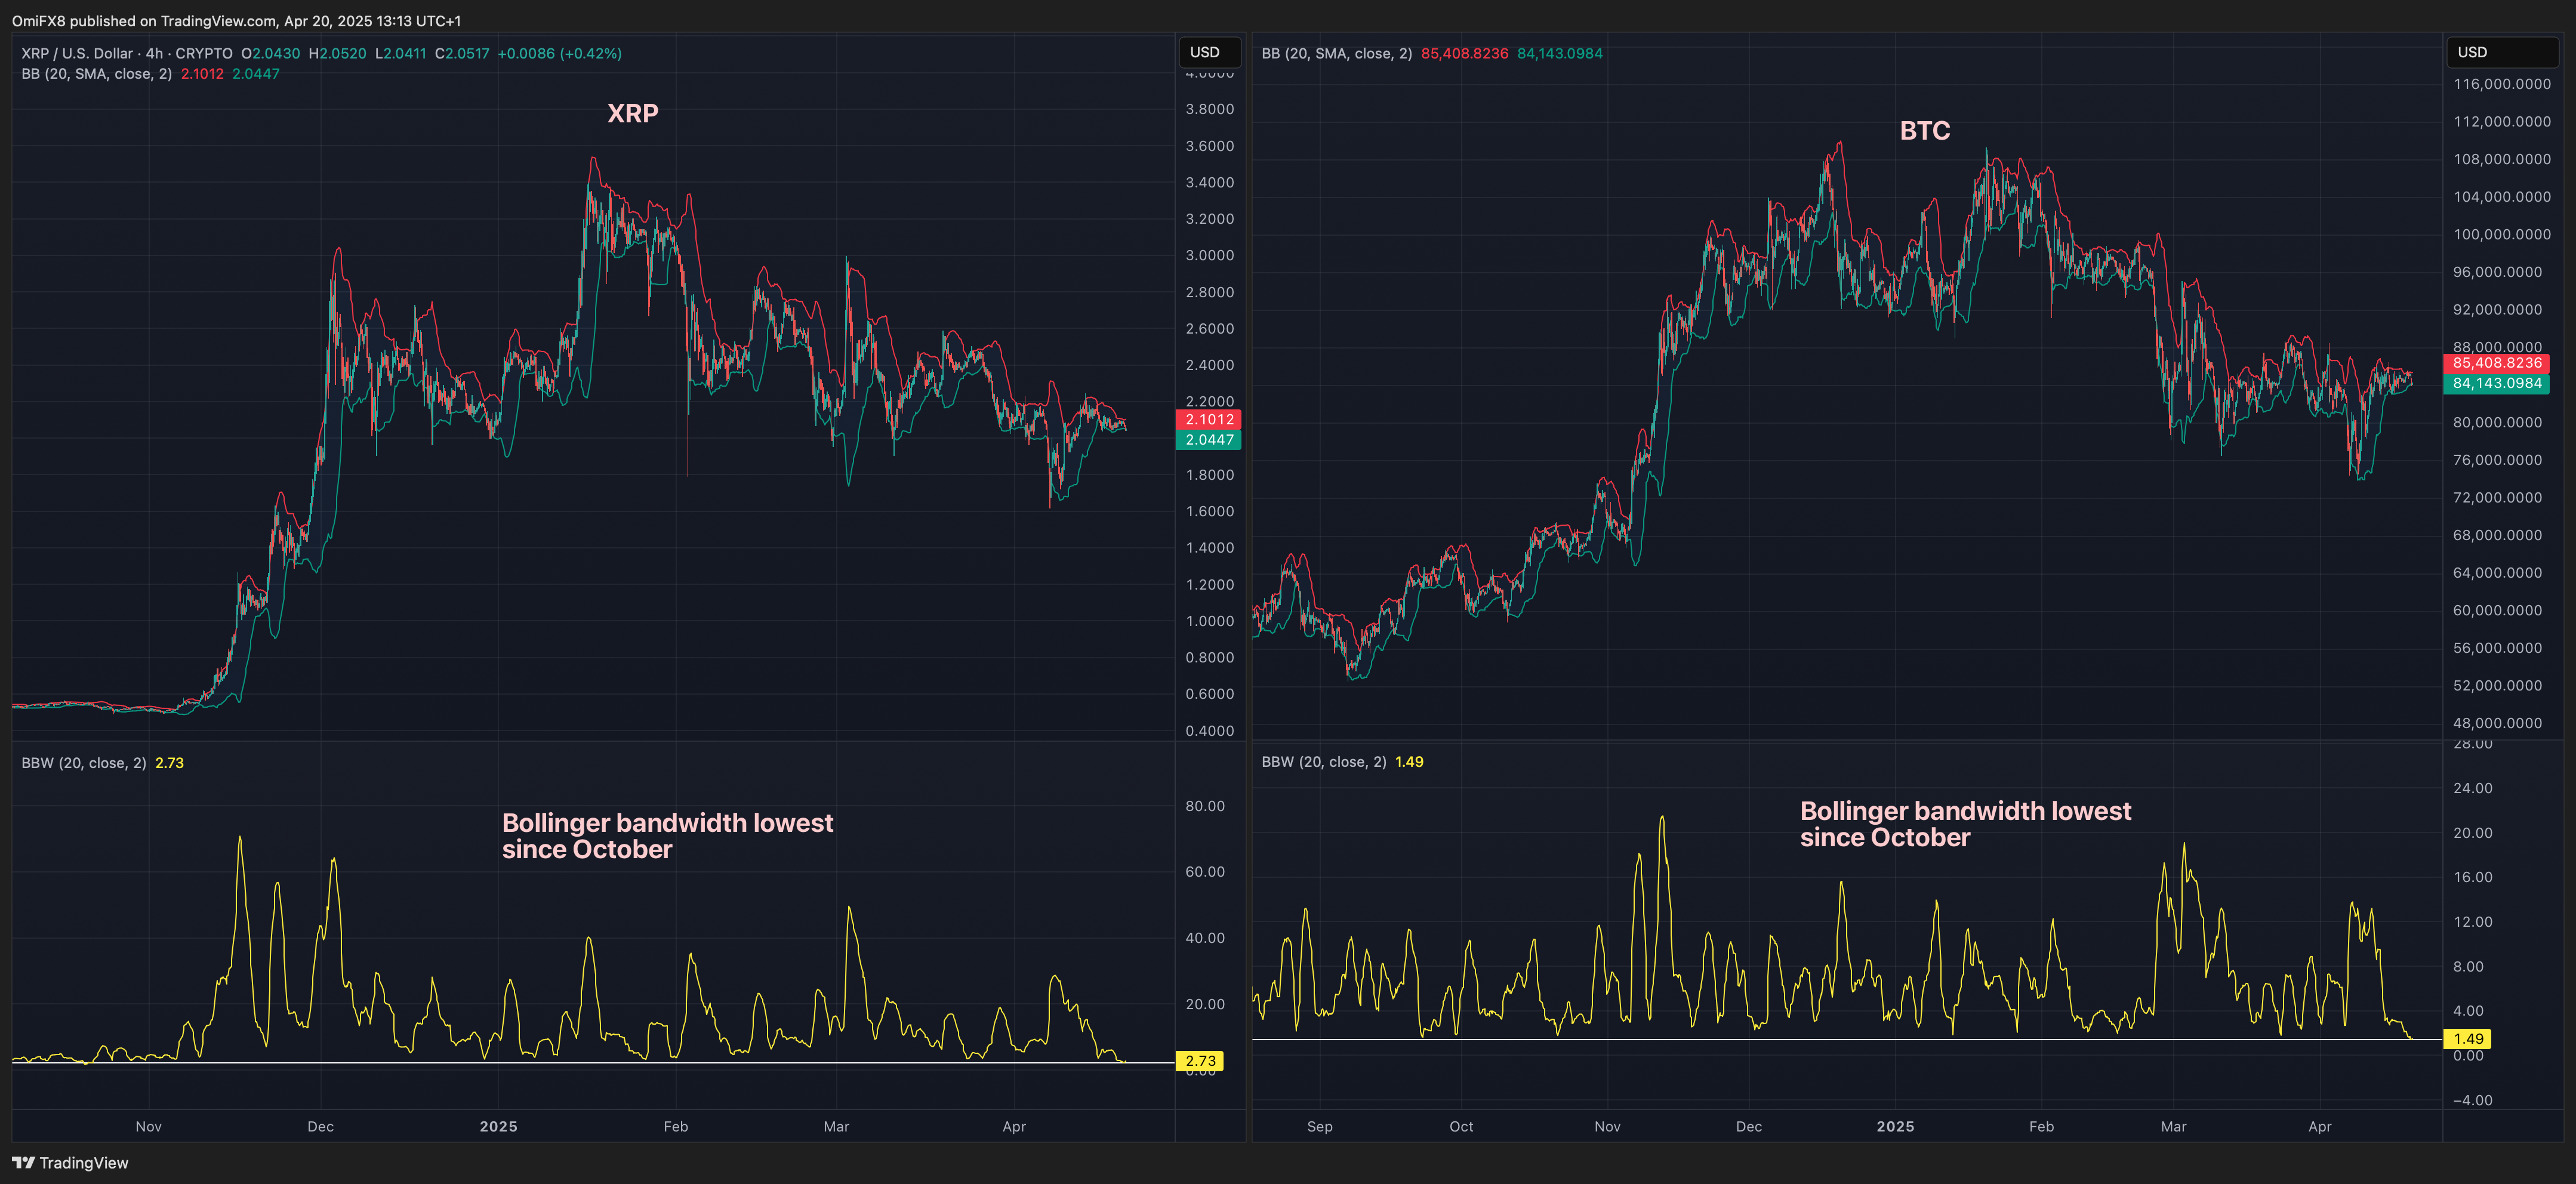
Technical analysis of XRP’s current price action reveals striking similarities to historical patterns observed in Q1 2024, when the asset subsequently experienced significant volatility. Market indicators suggest the cryptocurrency is building substantial potential energy within its narrowing trading range, with Bollinger Band width contracting to levels not seen since previous breakout periods. The TD Sequential indicator currently flashing a buy signal at the same precise setup that preceded the 32% rally in February 2024, while the 30-day volatility index has compressed to just 18% - matching the multi-month lows that typically precede large directional moves. On-chain metrics show whales have accumulated over 120 million XRP in the past fortnight, with futures open interest climbing 47% despite the sideways price action, creating what derivatives analysts describe as a ’volatility vortex’ scenario. The monthly chart’s symmetrical triangle formation is approaching its apex with the RSI at a neutral 54, leaving technical traders anticipating resolution of this energy buildup in either direction, though the historical tendency for spring-like breakouts following such compression periods suggests bullish potential.