Bitcoin Holds the Line: Will It Break or Bounce in 2025?

Bitcoin's price action has traders on edge—testing a critical support level that could define the next major market move.
The Technical Standoff
Forget the hype. The charts tell a clearer story. Bitcoin isn't just trading; it's defending a line in the sand. A sustained hold here suggests accumulation, a break below could trigger a cascade of automated sell orders. The volume tells you everything—quiet before the storm, or calm before the rally.
Market Mechanics at Play
This isn't about narratives. It's about liquidity and leverage. Large holders are watching the same levels as retail futures traders, creating a tension that will snap in one direction. The move, when it comes, won't be subtle. It will be a decisive breach or a violent rejection.
Institutional vs. Retail Sentiment
The divide is stark. On one side, cold storage wallets see this as a buying zone. On the other, leveraged positions sweat every minor dip. This creates the volatility that makes headlines and, occasionally, fortunes—though usually for the guys who set the leverage rates in the first place.
What's Next for the Benchmark Asset?
The market waits. A bounce here validates the long-term thesis and could fuel the next leg up. A breakdown resets expectations and flushes out weak hands. There's no middle ground. In crypto, you're either right or you're liquidated—a system so efficient it makes traditional finance's quarterly earnings panic look like amateur hour.

Summarize the content using AI
![]()
ChatGPT

Grok
Bitcoin $90,357.50‘s price is currently hovering near its 100-week simple moving average (SMA), a crucial long-term support level in technical analysis. This level, seen as the last defense for bull traders, represents an approximately two-year trend line. As bitcoin retraces from its all-time highs above $126,000, market participants have keenly focused on this average. Meanwhile, the largest publicly traded Bitcoin investor, Strategy’s (MSTR), has dipped below a similar line of confidence, presenting an unfavorable example for the major cryptocurrency.
Why is the 100-Week Average for Bitcoin Critical?
The 100-week SMA serves as a common reference among technical analysts looking for signs of trend reversal or continuation. The fact that Bitcoin’s price has managed to maintain this line over the past three weeks suggests a hold on the decline for now. Bull traders may see any positive reaction from this average as a trampoline effect, hinting at the possibility of a new rally.
If the level breaks downward, market sentiment can quickly reverse. Under the pressure of selling, traders might reduce their positions, which could embolden bear traders and trigger more significant downward movements.
Why is Strategy Sending Warning Signals?
Strategy’s shares dropped below the 100-week SMA in November, illustrating how a similar scenario can pan out in the stock market. At the beginning of November, MSTR shares fell to $220, slipped below the average, and then a selling wave deepened, pulling the price down to $160. The company’s shares have lost over 60% in value from their peak of $457 within the year, drawing significant attention.

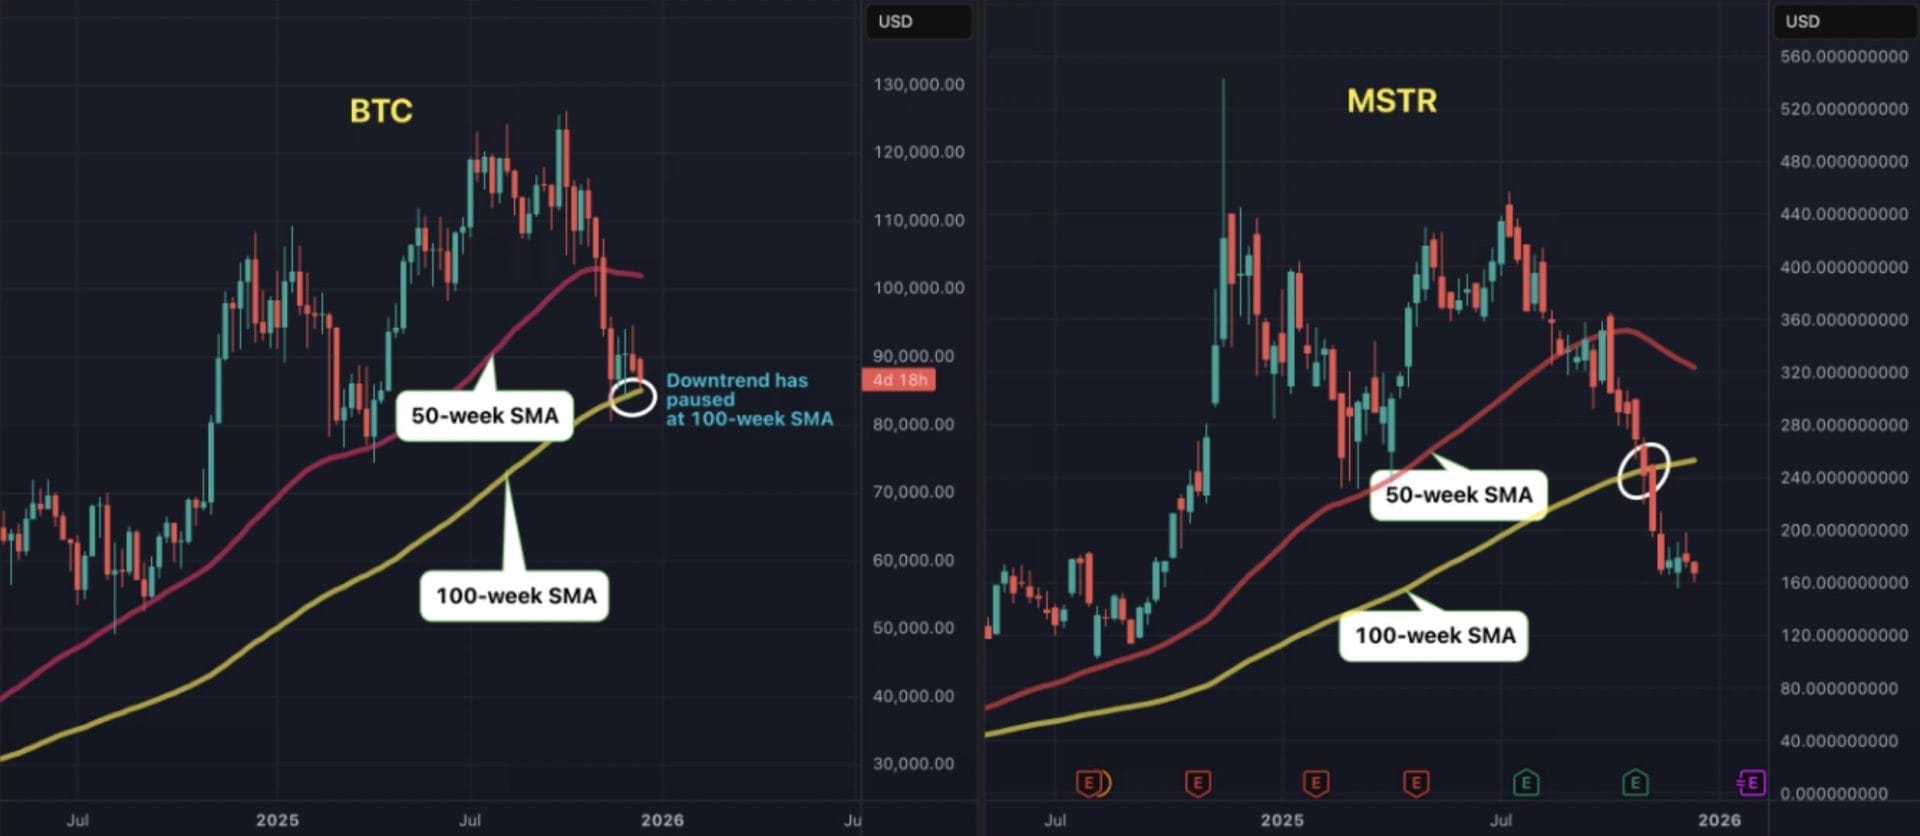
MSTR has emerged as a leading indicator for Bitcoin by previously producing a similar early warning when it fell below the 50-week SMA. Likewise, if Bitcoin also loses the 100-week average, it faces the risk of deeper losses, following a path similar to MSTR. Conversely, if the price remains above the average, it WOULD strengthen expectations that this support level may act as a foundation for recovery.
You can follow our news on Telegram, Facebook, Twitter & Coinmarketcap Disclaimer: The information contained in this article does not constitute investment advice. Investors should be aware that cryptocurrencies carry high volatility and therefore risk, and should conduct their own research.