ETH Price Prediction 2025: Technical & Fundamental Analysis Signals Strong Upside Potential

- Why Is Ethereum Showing Such Strong Bullish Momentum?
- How Significant Are the Exchange Supply Dynamics?
- What Does Institutional Activity Reveal?
- How Does Network Activity Support the Bull Case?
- What Are the Key Price Levels to Watch?
- Could ETH Really Reach $8,000?
- What Are the Risks to This Bullish Outlook?
- Frequently Asked Questions
Ethereum (ETH) is showing all the classic signs of a major breakout as we head into Q4 2025. With bullish technical indicators, shrinking exchange supplies, and growing institutional demand, our analysis suggests ETH could test $5,200 in the coming weeks. The cryptocurrency has maintained remarkable resilience despite typical September weakness, with whale accumulation patterns and ETF inflows creating what analysts are calling a "perfect storm" for price appreciation. Below we break down the 8 key factors driving ETH's bullish momentum and what price levels traders should watch.
Why Is Ethereum Showing Such Strong Bullish Momentum?
The current ETH rally isn't happening in isolation - it's being driven by multiple converging factors that create what technical analysts call a "confirmed uptrend." First, the MACD indicator shows a clear bullish crossover with a reading of 103.18 and positive histogram of 127.80. This suggests strong underlying momentum even during periods of price consolidation. Second, ETH has consistently held above crucial support at $4,044.23 (the lower Bollinger Band), while the upper Bollinger Band sits at $4,802.87 - a likely near-term target.
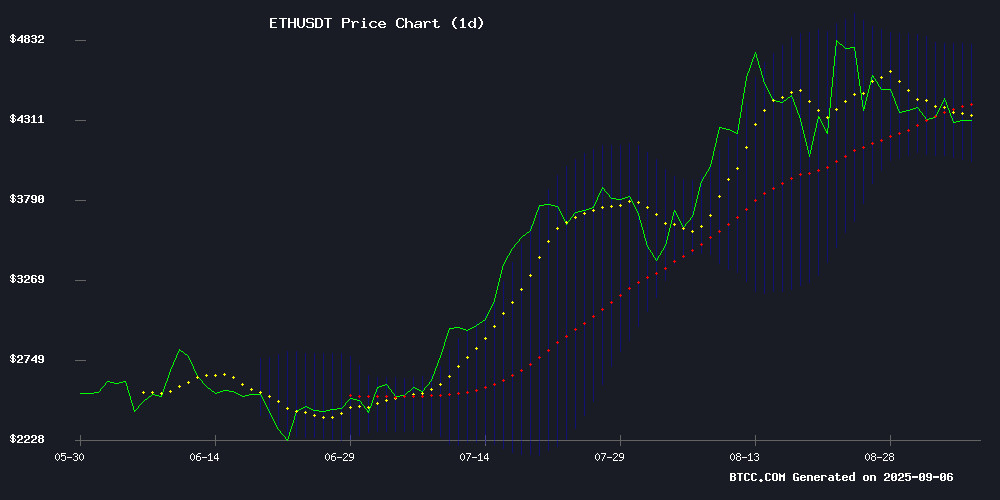
Source: BTCC TradingView
How Significant Are the Exchange Supply Dynamics?
Ethereum's exchange reserves tell perhaps the most compelling story. Binance's ETH Exchange Supply Ratio (ESR) has plummeted from 0.041 to below 0.037 in just two weeks - the steepest decline we've seen in months. This means billions worth of ETH are being pulled from exchanges into private wallets, creating what economists call a "supply shock." When this much liquidity disappears from trading platforms, even moderate buying pressure can cause disproportionate price movements.
What Does Institutional Activity Reveal?
The smart money is clearly positioning for higher prices. Data shows wallets holding 1,000-100,000 ETH have increased their holdings by 14% over the past five months. Even more telling is the $448.92 million ETH accumulation spree by known institutional players. As the BTCC research team noted, "Whale accumulation during volatility typically precedes major advances - we're seeing textbook accumulation patterns here."
How Does Network Activity Support the Bull Case?
Ethereum's fundamentals are firing on all cylinders:
- Record 48.22 million monthly transactions (5.8% monthly increase)
- $320 billion August trading volume (3rd highest ever)
- DeFi TVL approaching all-time highs at $92.24 billion
- 64,793 new addresses created in 24 hours
This level of network usage creates organic demand that goes far beyond speculative trading.
What Are the Key Price Levels to Watch?
Based on current technicals and market structure, these are the crucial levels traders should monitor:
| Price Level | Significance | Probability | Timeframe |
|---|---|---|---|
| $4,800-5,000 | Upper Bollinger Band target | High | 2-4 weeks |
| $5,200-5,500 | Institutional accumulation zone | Medium | 4-8 weeks |
| $6,000+ | Macro adoption target | Moderate | 3-6 months |
Could ETH Really Reach $8,000?
While $8,000 might sound ambitious to some, the math actually checks out when you consider:
- ETF inflows totaling $3.9 billion (68% increase)
- Shrinking liquid supply (exchange balances negative for first time ever)
- Network upgrades reducing fees and improving performance
- Historical patterns showing 12-18 month cycles between major highs
As one hedge fund manager quipped, "ETH at $8k WOULD still only be a $1 trillion market cap - half of Apple's valuation for the entire decentralized internet."
What Are the Risks to This Bullish Outlook?
No analysis would be complete without considering potential downside risks:
- Regulatory uncertainty remains the "elephant in the room"
- Macroeconomic conditions could deteriorate
- Technical breakdown below $4,200 could trigger stop losses
- Competitor networks continue improving scalability
That said, the current risk/reward ratio appears favorable with so many bullish factors converging.
Frequently Asked Questions
What is the most important technical indicator for ETH right now?
The MACD showing a bullish crossover with reading of 103.18 and positive histogram of 127.80 suggests strong underlying momentum. Combined with price holding above the lower Bollinger Band at $4,044.23, this creates a favorable setup for upward movement.
How significant is the ETH supply leaving exchanges?
Extremely significant. The Exchange Supply Ratio dropping from 0.041 to 0.037 represents billions worth of ETH being pulled from trading platforms. This creates a supply squeeze where even moderate buying pressure can cause disproportionate price movements.
What time frame are the $5,200-5,500 targets based on?
These targets are based on a 4-8 week timeframe, assuming current accumulation patterns continue and no major macroeconomic shocks occur. The upper Bollinger Band target of $4,800-5,000 comes first in the 2-4 week window.
Is September typically bad for ETH prices?
Historically yes, but 2025 is breaking the pattern. Whale accumulation of 3.69 million ETH in under 24 hours combined with retail weakness (short-term holder NUPL metrics at 0.21) suggests this September could be different.
How reliable are the $8,000 longer-term predictions?
While not guaranteed, the $8,000 target becomes plausible when considering ETF demand maturation, supply dynamics, and historical cycle patterns. It would represent a less than 2x move from current levels - modest by crypto standards.
