PEPE Price Prediction 2025: Bullish Signals Emerge Despite Market Volatility

- What Do PEPE's Technical Indicators Reveal?
- Why Is Trading Volume Such a Concern?
- Could the TD Sequential Signal a Major Rally?
- How Does PEPE Compare to Other Meme Coins?
- Is Now the Time to Buy PEPE?
- PEPE Price Prediction Q&A
As we approach the second half of 2025, PEPE (PEPEUSDT) presents a fascinating case study in meme coin resilience. Currently trading at $0.00001120, this frog-themed cryptocurrency shows conflicting technical signals that have traders divided. While the MACD indicates growing bullish momentum, plunging trading volumes and proximity to key support levels suggest caution. Our analysis dives deep into the technical crosscurrents shaping PEPE's potential path forward, examining everything from Bollinger Band positioning to the intriguing TD Sequential buy signal that's got the crypto community buzzing.
What Do PEPE's Technical Indicators Reveal?
The BTCC research team notes Pepe currently trades below its 20-day moving average ($0.00001177), typically a bearish sign. However, the MACD tells a different story, with its histogram reading +0.00000050 - a classic bullish divergence. Price action near the lower Bollinger Band ($0.00000921) adds another layer, potentially signaling oversold conditions ripe for reversal.
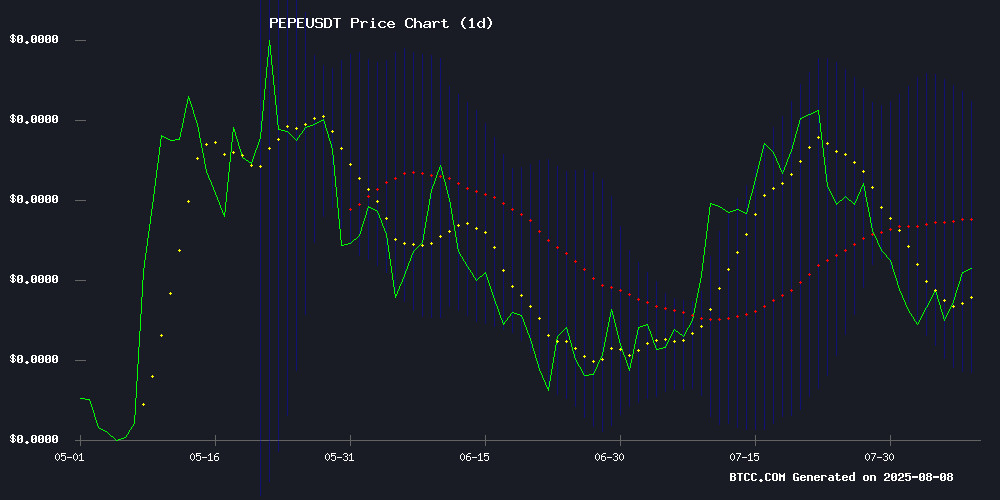
Source: TradingView
Why Is Trading Volume Such a Concern?
Here's where things get tricky. While technicals hint at upside, PEPE's trading volume tells a cautionary tale. Daily volume has cratered from $2.2 billion in mid-July to just $400 million in August - an 82% nosedive that raises serious liquidity questions. Futures open interest mirrors this decline, dropping from $1 billion to $590 million in the same period.
Could the TD Sequential Signal a Major Rally?
The crypto sphere lit up when the TD Sequential flashed a buy signal at $0.00001064, already yielding 2% gains. Historical patterns show PEPE's biggest rallies occur when volumes exceed $1 billion - a threshold we're currently well below. The $0.000012 near-term target (11% upside) seems plausible, but that ambitious $1 prediction making rounds on Crypto Twitter? Let's just say the math gets... creative.
How Does PEPE Compare to Other Meme Coins?
Despite its struggles, PEPE maintains dominance as the third-largest meme coin with a $2 billion market cap lead over competitors like Pudgy Penguins. Its ability to hold the $0.00001-$0.000011 consolidation range through multiple bearish waves since May's peak demonstrates surprising structural strength in this volatile sector.
Is Now the Time to Buy PEPE?
This article does not constitute investment advice. That said, the technical setup presents an interesting risk-reward proposition for traders comfortable with meme coin volatility. The bullish case rests on three pillars: the MACD momentum, TD Sequential signal, and potential mean reversion from oversold Bollinger levels. The bearish counterarguments - dwindling volume and precarious support - deserve equal consideration.
For those considering a position, strict risk management is essential. The $0.000009 level appears critical - a breakdown here could trigger accelerated selling. Conversely, sustained volume above $500 million might confirm the bullish technical signals.
PEPE Price Prediction Q&A
What are the key support and resistance levels for PEPE?
Current support sits at $0.000010, with $0.000009 representing a critical psychological level. Resistance appears at the 20-day MA ($0.00001177) and the middle Bollinger Band at $0.000012.
How reliable is the TD Sequential indicator for PEPE?
While the TD Sequential has accurately predicted several PEPE reversals, its effectiveness depends on confirming volume. The current buy signal appears valid but requires volume expansion to reach its full potential.
Why has PEPE volume dropped so dramatically?
The decline reflects both broader crypto market conditions and typical summer liquidity droughts. Some analysts speculate institutional players may be waiting on the sidelines for clearer macroeconomic signals.
What would confirm a true PEPE trend reversal?
Traders should watch for: 1) Sustained volume above $700 million, 2) A close above the 20-day MA, and 3) MACD line crossing above the signal line on the daily chart.
