Bitcoin News: Signs of Whale Exit Strategy Emerge as BTC Tests Key Support Levels

- Whale Accumulation at $74K: Smart Money or Trapped Buyers?
- Short Squeeze Fuel? $375M Liquidation Cluster Looms
- Make-or-Break Levels: The $67.8K Line in the Sand
- FAQ: Your Bitcoin Market Questions Answered
Bitcoin's recent price action reveals a potential head-and-shoulders pattern amid whale accumulation NEAR all-time highs. With $68,000 as a critical support level, the market faces a tug-of-war between short squeezes and long-term holder accumulation. Technical analysis suggests a rebound toward $69,700 is possible, but failure to hold $67,800 could trigger a deeper correction. This article unpacks the on-chain data, derivatives positioning, and historical patterns shaping BTC's next move.
Whale Accumulation at $74K: Smart Money or Trapped Buyers?
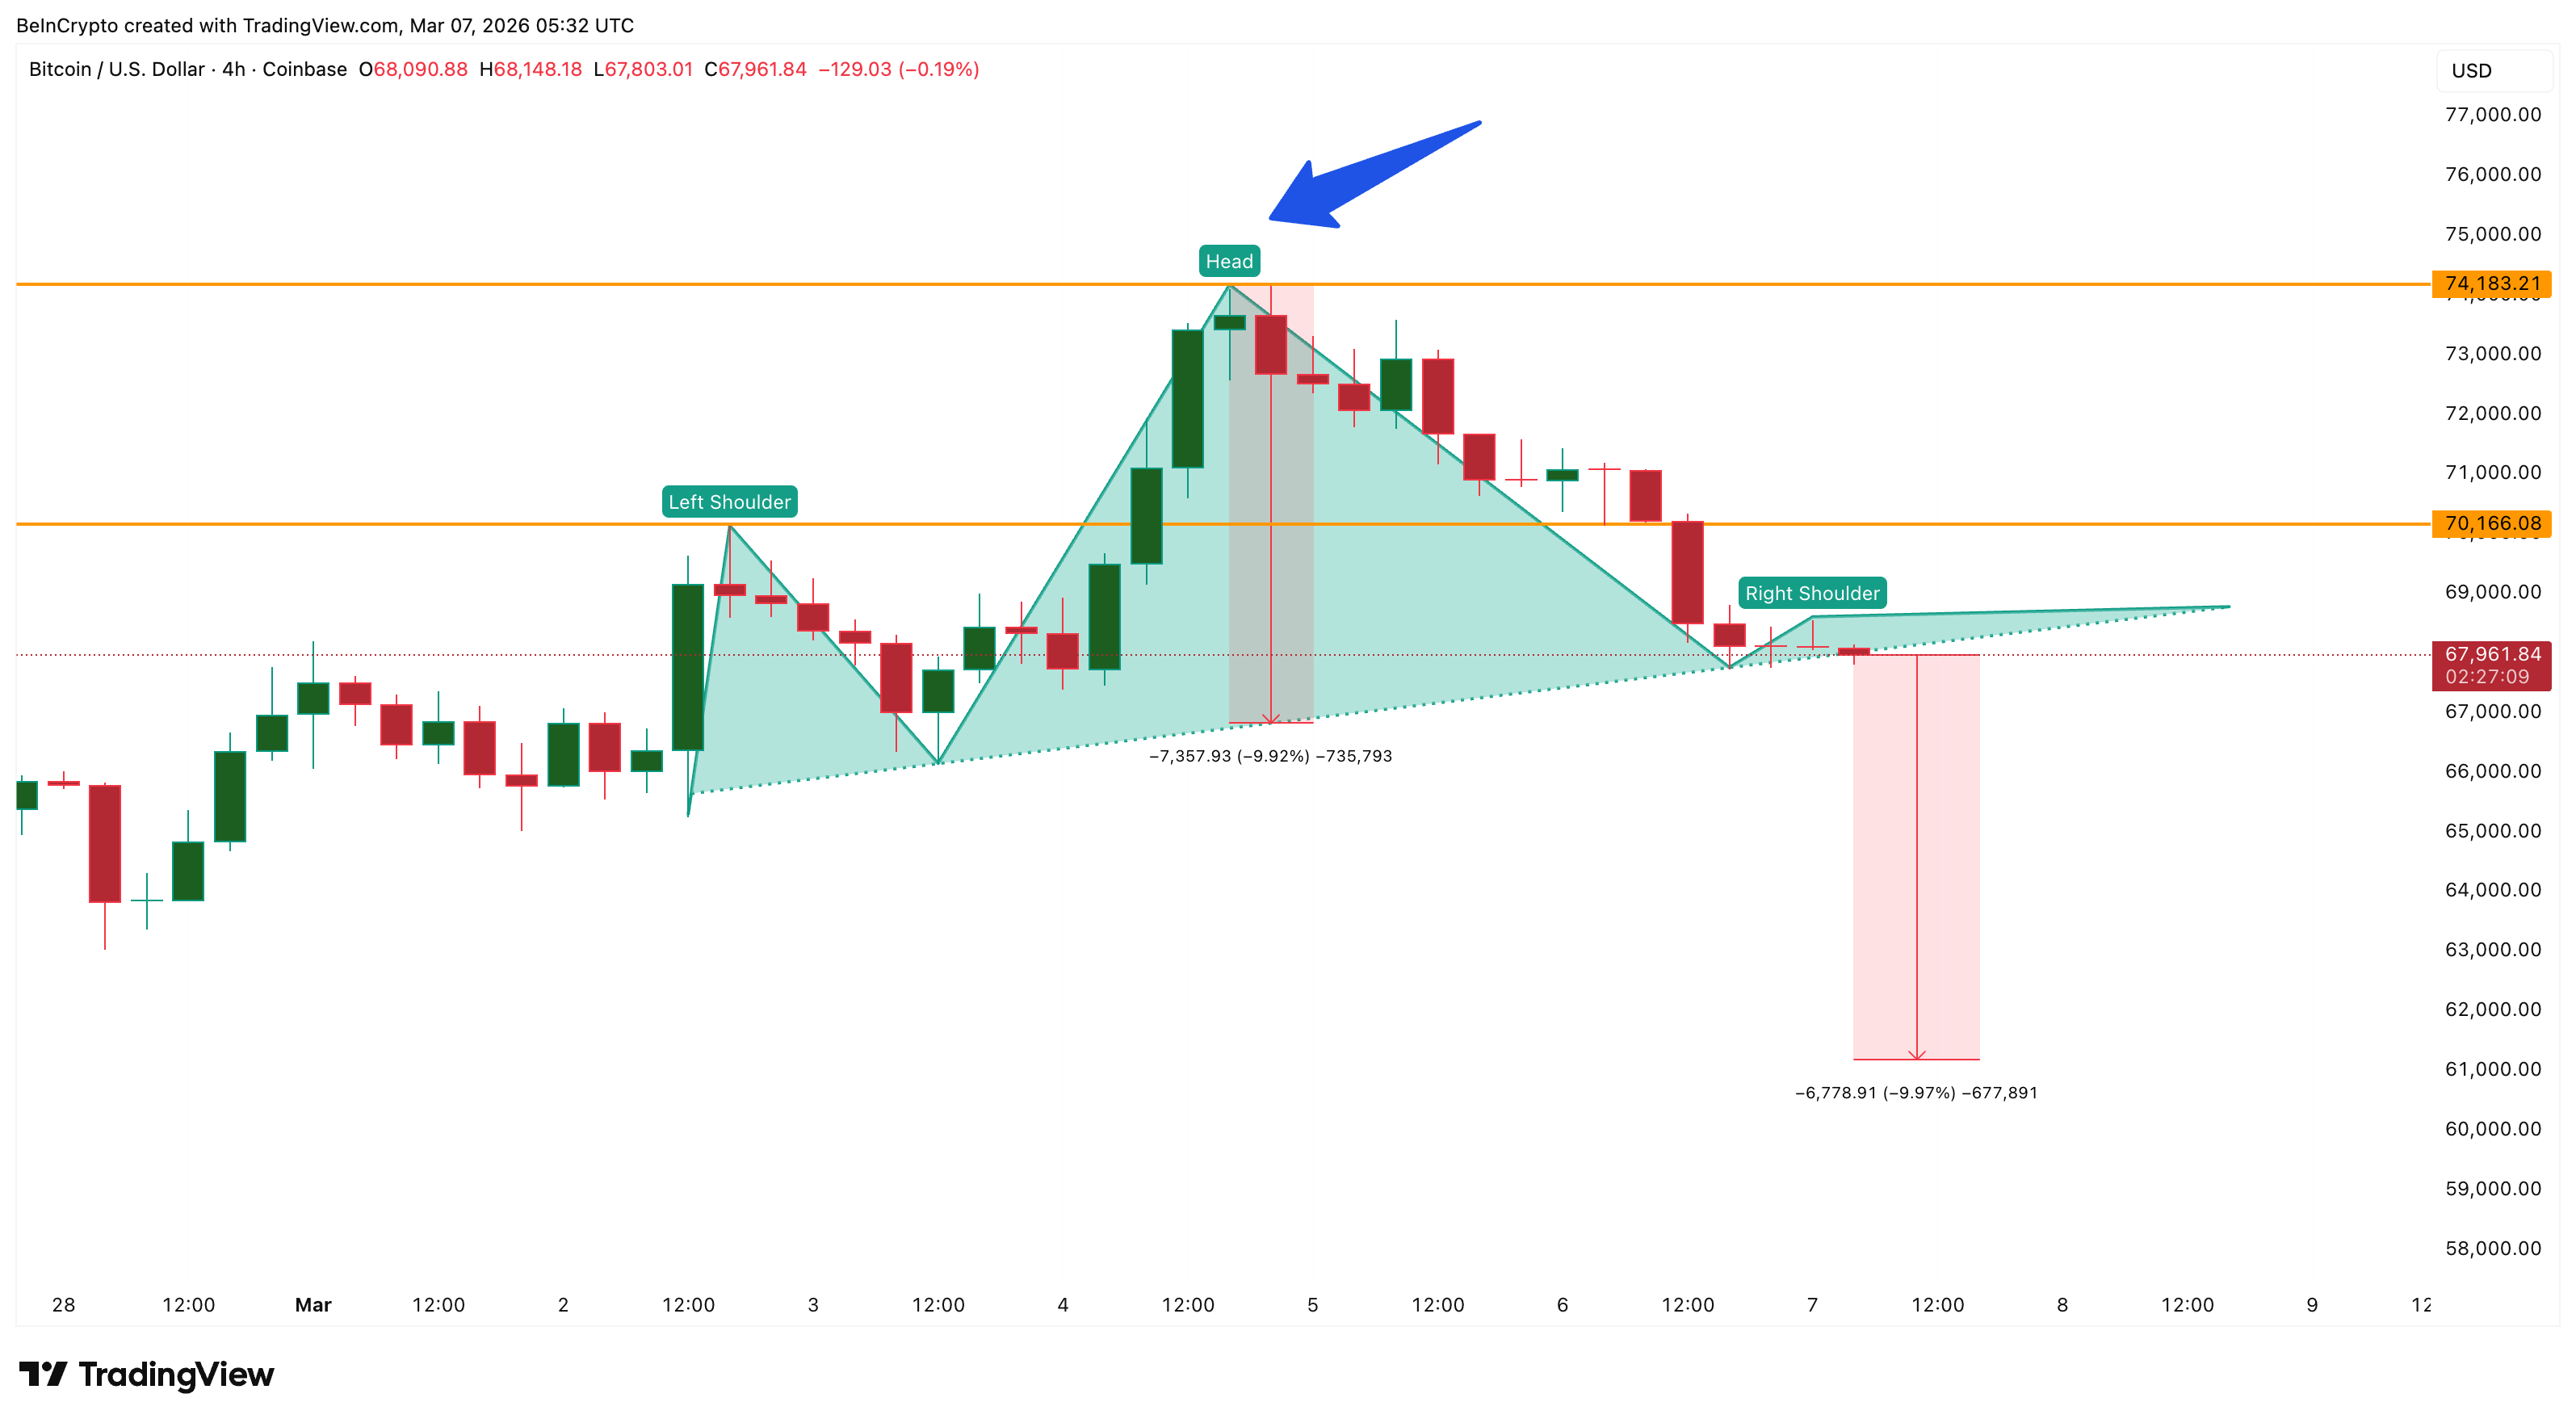
The 4-hour BTC chart shows a developing head-and-shoulders pattern, with the "head" forming at March 4's $74,100 peak. Interestingly, wallets holding 10,000-100,000 BTC increased their balances to 2.24 million BTC that same day—suggesting whales bought the top. "Don’t @ me as a party pooper, but I called this $68K retest days ago," tweeted analyst charlie0.eth on March 5, 2026. Their positions are now underwater as BTC hovers at $68,000.
Short Squeeze Fuel? $375M Liquidation Cluster Looms
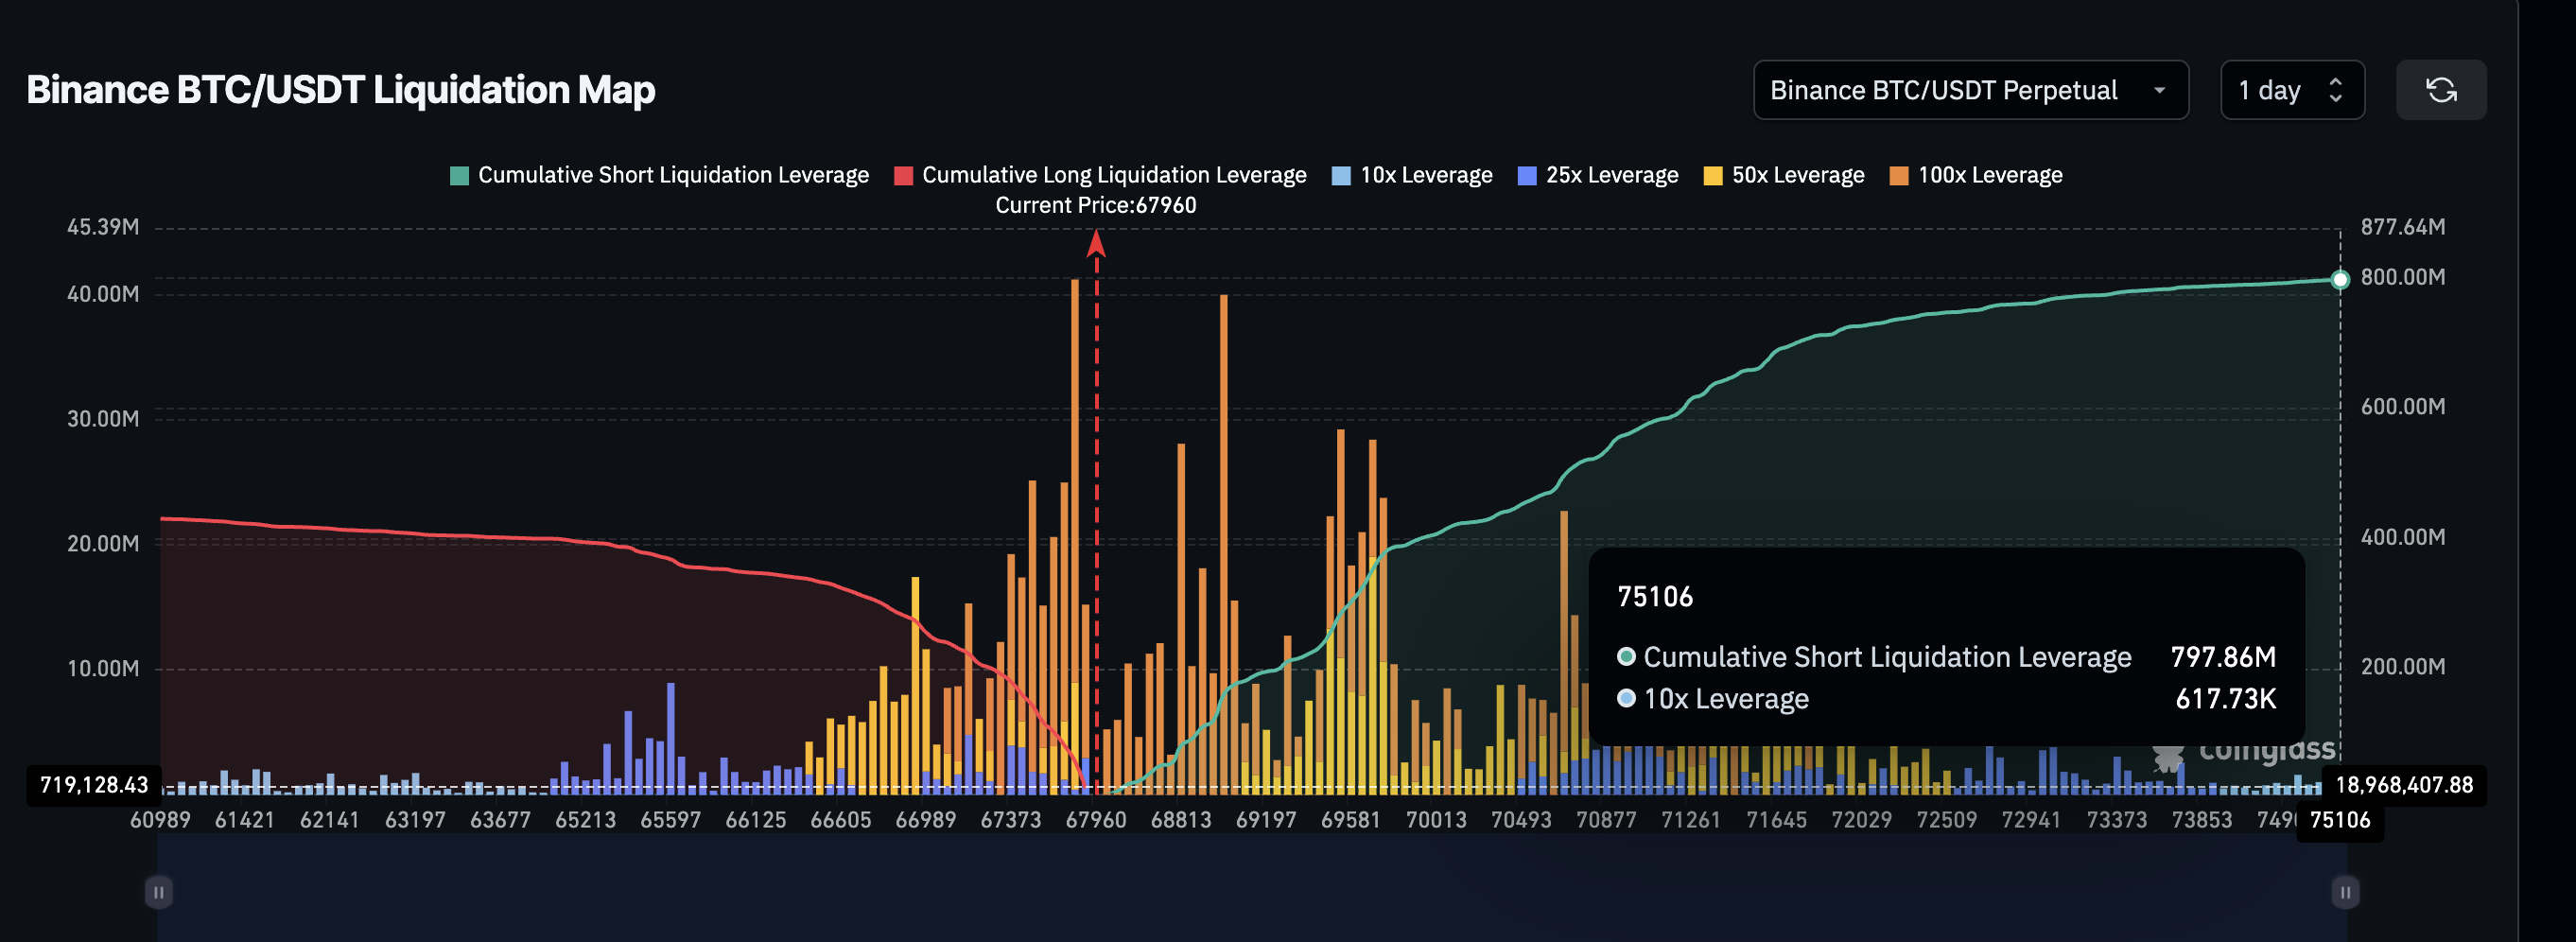
Binance's BTC/USDT perpetual swap shows a staggering 80% short bias ($798M shorts vs. $430M longs). A push above $69,700 could liquidate $375M in bearish bets—creating reflexive buying pressure. This aligns with a key resistance zone and coincides with long-term holders (LTHs) flipping net buyers on March 6 for the first time since January. Historically, similar LTH buying spikes preceded 2.5% rallies (like December 7, 2025's $90.4K→$92.7K move).
Make-or-Break Levels: The $67.8K Line in the Sand
The BTCC research team notes two scenarios:
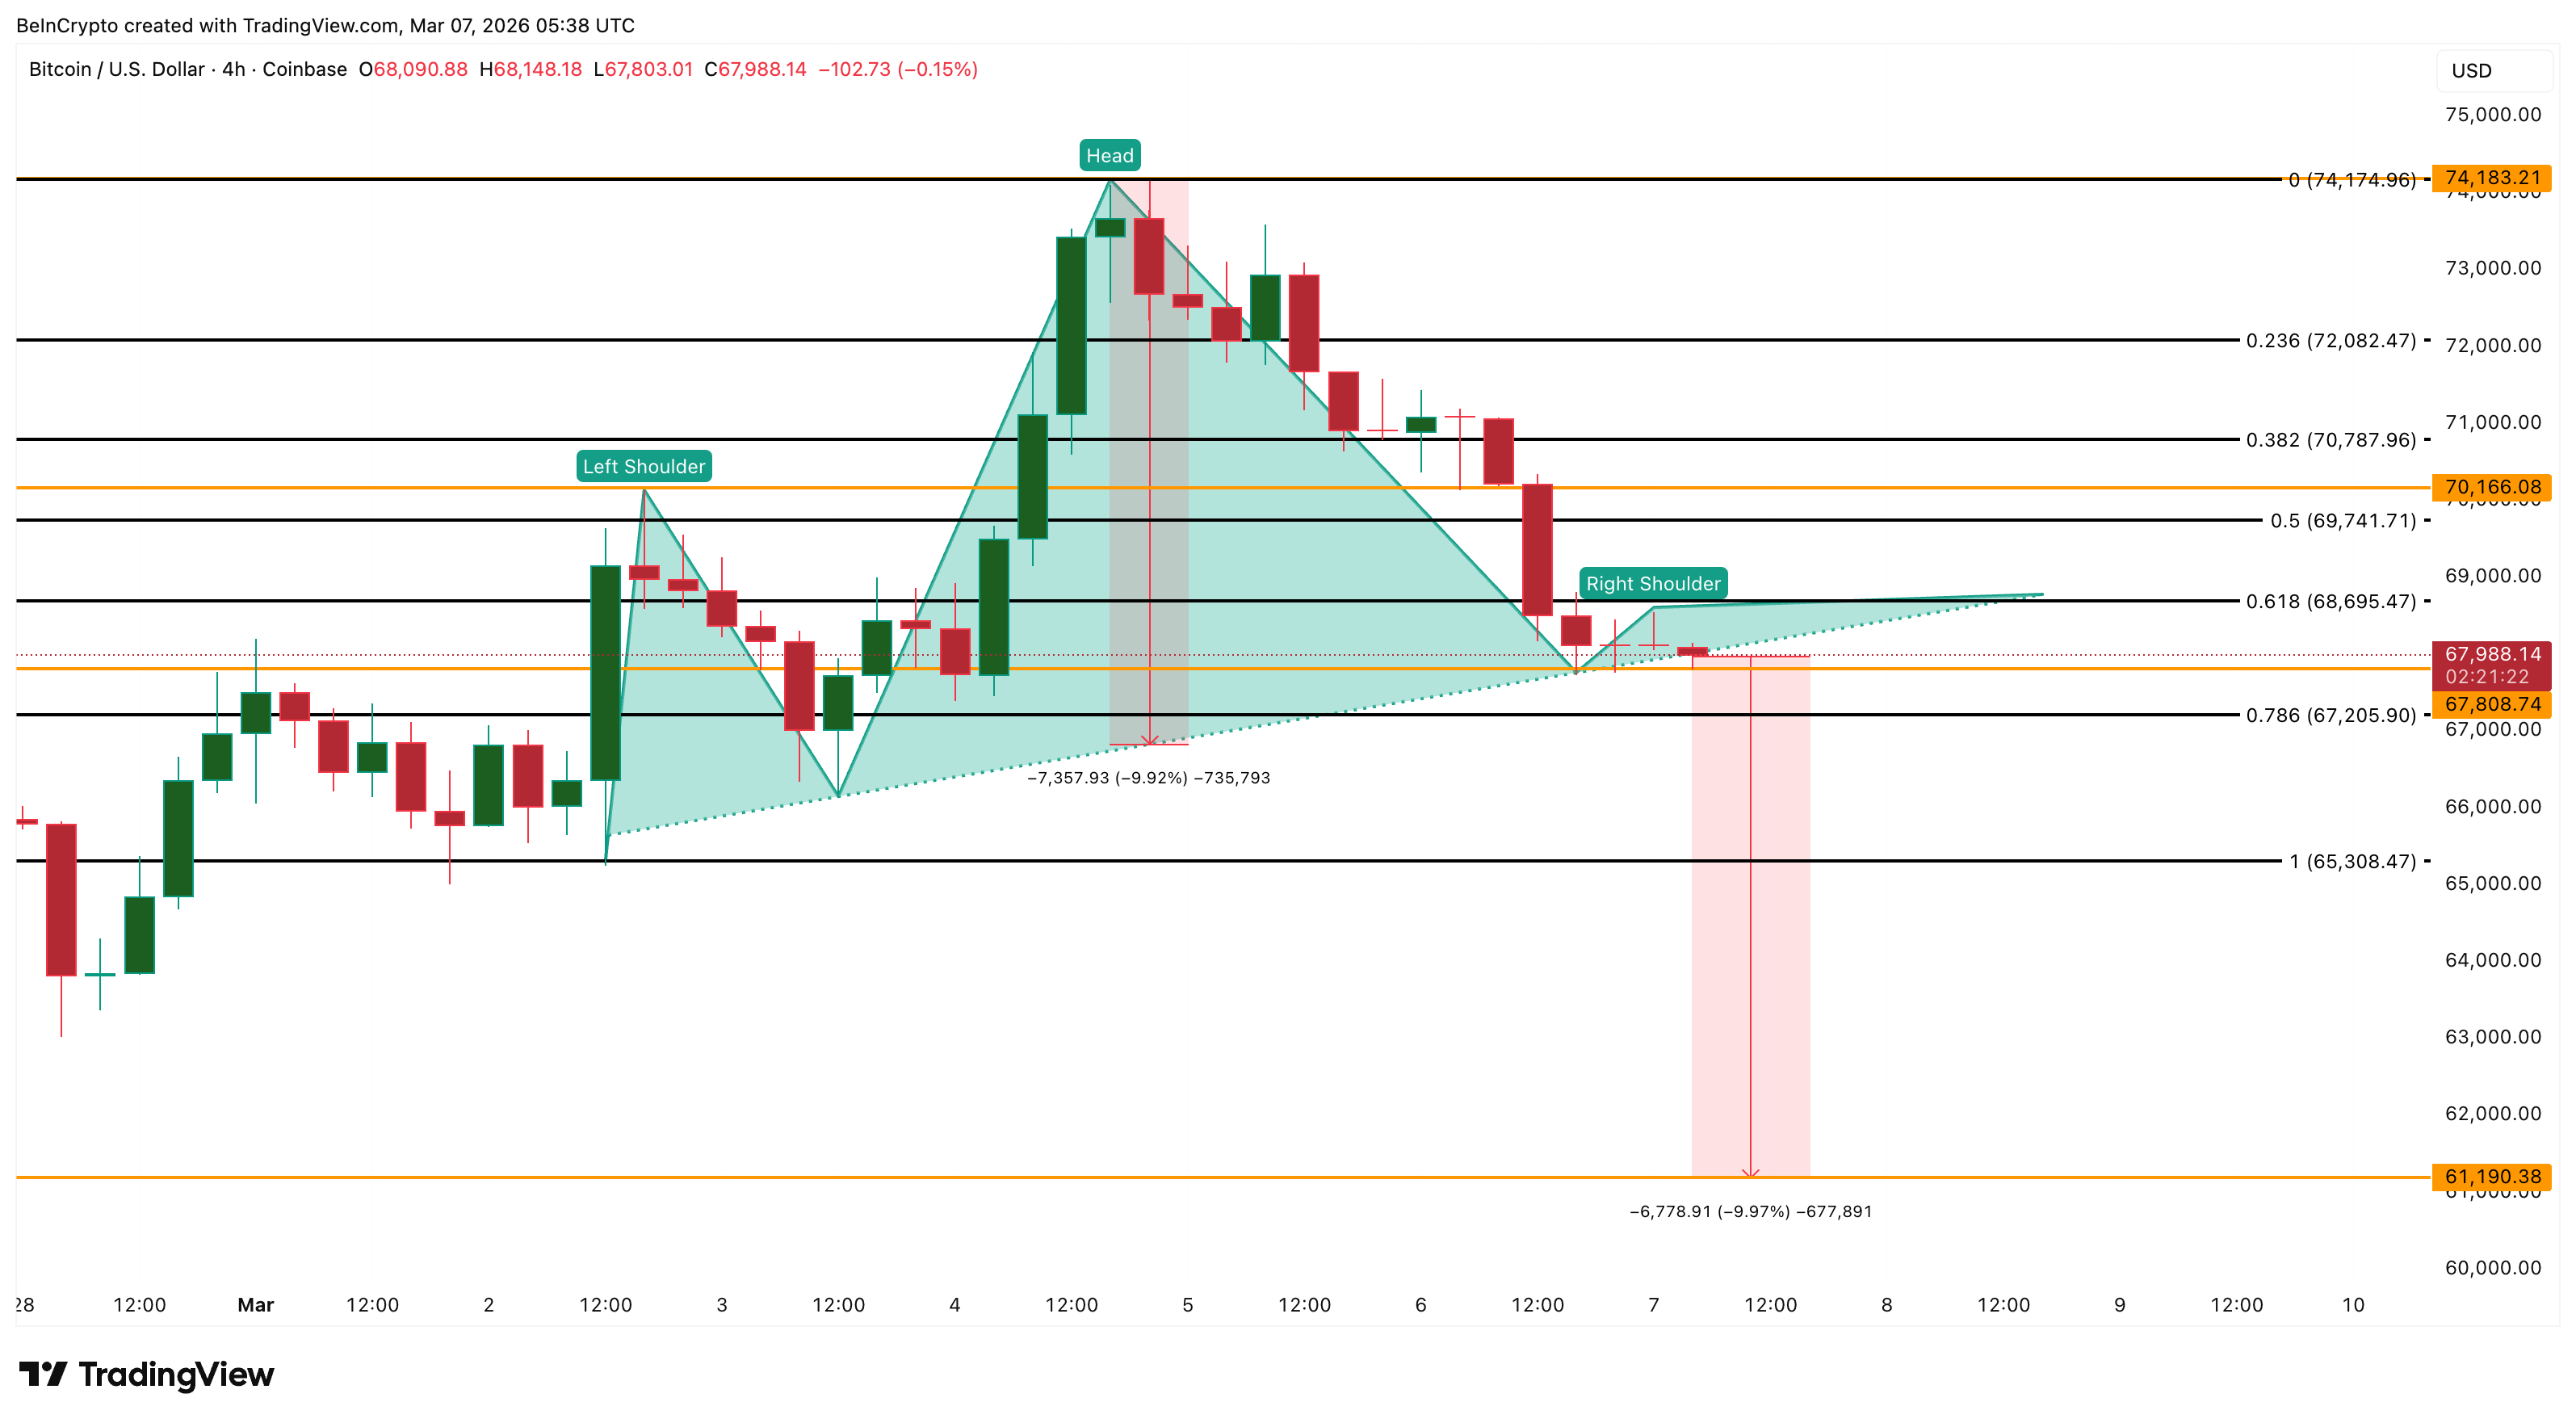
- Bullish: A 4-hour close above $68,600 opens path to $69.7K (liquidation zone) and potentially $72K.
- Bearish: Losing $67,800 confirms the head-and-shoulders pattern, targeting $65.3K and possibly $61.1K.
Weekend liquidity crunches—like the one during this price drop—often amplify volatility. As one trader quipped, "BTC on weekends either goes brrr or ouch. No in-between."
FAQ: Your Bitcoin Market Questions Answered
Why are whales buying at highs?
Possible reasons: 1) Hedging against other positions, 2) Anticipating ETF inflows, or 3) Miscalculating market cycles. Glassnode data shows their cost basis clusters near $69K.
How reliable is the head-and-shoulders pattern?
While statistically significant (70% accuracy in crypto per 2025 MIT study), patterns require volume confirmation. Current RSI at 42 suggests room for either direction.
Should traders follow long-term holders?
LTHs have stronger hands but poor timing—their March 6 accumulation came after a 9% drop. Dollar-cost averaging often outperforms copying their moves.
