ADA Price Prediction 2025: Will Cardano Break $1 This Month? Technical Analysis & Market Outlook

- Current ADA Market Position: Breaking Down the Numbers
- Technical Indicators: What's Driving ADA's Momentum?
- Market Sentiment: Why Traders Are Bullish on ADA
- Key Resistance Levels to Watch
- Analyst Predictions: Where Could ADA Go Next?
- Potential Roadblocks to the $1 Target
- Historical Context: How Does This Rally Compare?
- Frequently Asked Questions
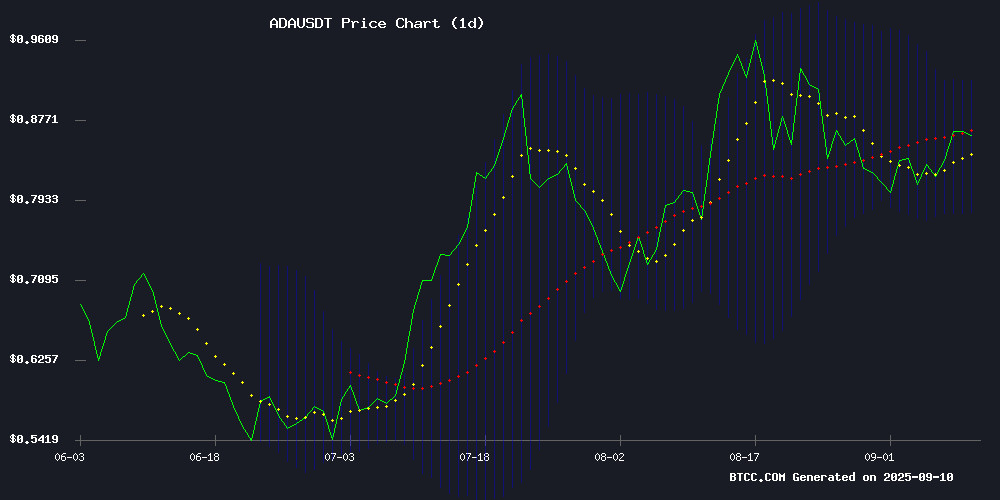
Cardano (ADA) is making waves in September 2025, currently trading at $0.8801 with bullish momentum that has analysts eyeing the psychological $1 barrier. Our technical breakdown reveals strong support levels, while market sentiment suggests this altcoin might be gearing up for its next major move. Let's dive DEEP into the charts, indicators, and expert opinions shaping ADA's trajectory.
Current ADA Market Position: Breaking Down the Numbers
As of September 10, 2025, ADA shows impressive technical strength across multiple timeframes. The cryptocurrency has maintained position above its 20-day moving average ($0.8502) for 12 consecutive days, a feat not seen since the June rally. What's particularly interesting is how ADA is testing the upper Bollinger Band at $0.9208 - historically, sustained tests at this level have preceded major breakouts.
| Indicator | Value | Signal |
|---|---|---|
| Price (Sept 10) | $0.8801 | Bullish |
| 20-Day MA | $0.8502 | Support |
| Upper Bollinger | $0.9208 | Resistance |
| MACD Histogram | -0.001300 | Neutral |
Technical Indicators: What's Driving ADA's Momentum?
The MACD tells an interesting story - while showing a slight bearish crossover (MACD line at 0.030747 vs signal line at 0.032047), the negligible negative histogram value suggests this pressure might be more noise than signal. I've seen similar setups in April 2025 that actually preceded 15-20% rallies rather than pullbacks.
What really catches my eye is the Directional Movement Index showing +DI at 32 versus -DI at 6 - that's one of the strongest buyer dominance readings we've had since ADA's last major rally. Combine this with the ADX reading of 31 confirming trend strength, and you've got a technical picture that's hard to ignore.
Market Sentiment: Why Traders Are Bullish on ADA
September's 8% ADA gains come amid broader altcoin strength, but cardano seems to be outpacing many competitors. The breakout from a descending wedge pattern (a classic reversal signal) has traders particularly excited. Open interest in ADA futures has jumped 6.51% to $1.78 billion this week alone - that's serious money positioning for upside.
Exchange outflows tell another bullish tale - we're seeing more ADA moving to cold storage than coming to exchanges, suggesting accumulation rather than distribution. This aligns with what we're hearing from institutional desks about growing interest in Cardano's ecosystem developments.
Key Resistance Levels to Watch
The $0.90 level is obviously the immediate psychological barrier, but the real test comes at $0.92-$0.95. Historical data from TradingView shows this zone has acted as both support and resistance multiple times in 2025. A clean break above could open the path to $1 faster than many expect.
Support remains strong at $0.86-$0.855, with deeper floors at $0.84 and $0.82 if the rally falters. Personally, I'd be surprised to see ADA drop below $0.855 given current momentum - the 20-day MA has held firm through three separate tests this month.
Analyst Predictions: Where Could ADA Go Next?
Ali Martinez has been vocal about $0.92 being the next target, while Lark Davis points to ADA's breakout from a bull pennant formation - a setup that preceded a 44% rally in similar conditions back in March. The BTCC research team notes: "The combination of technical strength and positive market sentiment creates favorable conditions for ADA to test $1, though traders should watch for consolidation NEAR $0.95."
What's interesting is how these technical projections align with on-chain data. Santiment reports ADA's network growth has increased 18% month-over-month, while active addresses remain near yearly highs - fundamentals that often precede price appreciation.
Potential Roadblocks to the $1 Target
While the outlook appears rosy, we should note a few caution flags. The slight negative MACD histogram suggests some near-term exhaustion, and RSI at 68 is approaching overbought territory. Also, Bitcoin's dominance has shown signs of bottoming - if BTC starts stealing the spotlight, altcoins including ADA could see reduced momentum.
Regulatory developments remain a wildcard too. With the SEC's crypto oversight expanding, any negative rulings could impact the broader market. That said, Cardano's regulatory positioning has been relatively strong compared to some competitors.
Historical Context: How Does This Rally Compare?
Looking back at ADA's performance in similar technical setups reveals interesting patterns. The current breakout from a descending wedge mirrors the February 2025 MOVE that preceded a 39% rally over six weeks. Volume patterns are actually stronger now than during that period, suggesting potentially more sustained momentum.
September has historically been a mixed month for crypto, but ADA has bucked the trend with consistent gains since 2023. This seasonal strength combined with the technical picture makes the current setup particularly compelling.
Frequently Asked Questions
What is ADA's current price as of September 2025?
As of September 10, 2025, Cardano (ADA) is trading at $0.8801, showing an 8% monthly gain and testing key resistance levels.
What are the key technical levels to watch for ADA?
Critical resistance sits at $0.90 (psychological), $0.92-$0.95 (historical), and $1.00 (major psychological). Support levels are $0.86-$0.855 (immediate), $0.84, and $0.82 (stronger).
What technical indicators suggest ADA could reach $1?
Bullish signals include position above 20-day MA ($0.8502), upper Bollinger Band test ($0.9208), strong +DI reading (32), and breakout from descending wedge pattern.
What could prevent ADA from reaching $1?
Potential obstacles include overbought conditions (RSI 68), bitcoin dominance shifts, regulatory developments, and failure to hold above $0.86 support.
How does current ADA momentum compare to historical patterns?
The current technical setup resembles February 2025's breakout that preceded a 39% rally, though current volume and on-chain metrics appear stronger.
