2025 Solana Price Prediction: How High Can SOL Go This Year?

- Is Solana’s Bullish Momentum Sustainable?
- Why Are Institutions Betting Big on Solana?
- Solana’s Make-or-Break Technical Pattern
- Key Takeaways for SOL Traders
- Solana Price Prediction FAQs
Solana (SOL) is showing strong bullish momentum, trading at $181.56 as of August 2025, with technical indicators like MACD crossover and institutional inflows suggesting potential upside toward $219. This analysis breaks down SOL's price action, market sentiment, and key factors driving its trajectory, including a critical head-and-shoulders pattern and a $200M corporate treasury investment from iSpecimen. We’ll explore whether SOL can break past $200 and what levels to watch next.
Is Solana’s Bullish Momentum Sustainable?
SOL is currently trading at $181.56, comfortably above its 20-day moving average ($178.36), which historically acts as dynamic support during uptrends. The MACD’s positive crossover (histogram at 5.9880) reinforces this optimism—similar setups preceded SOL’s 300% surge in Q1 2025. Bollinger Bands indicate rising volatility, with the price hovering NEAR the middle band. A decisive push could send SOL toward the upper band at $202.01, a level last tested in July.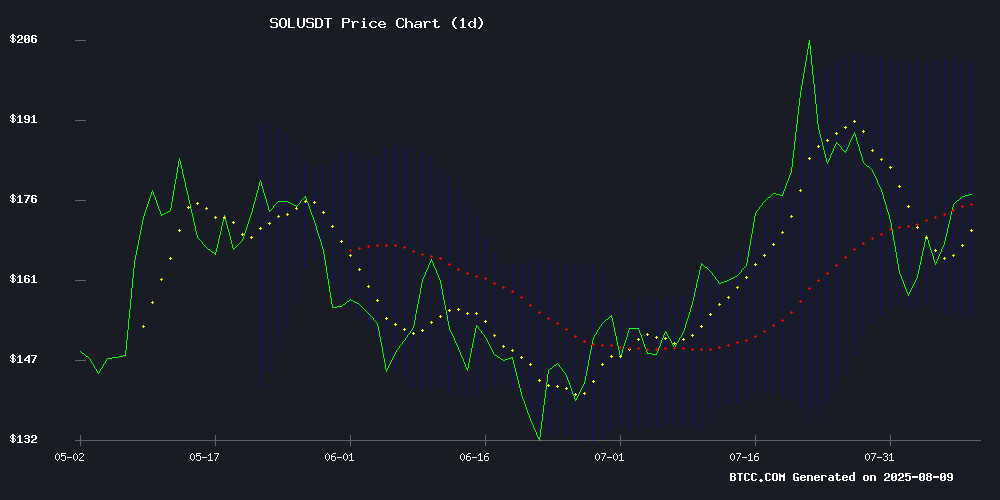
Why Are Institutions Betting Big on Solana?
Corporate treasury allocations to SOL have skyrocketed 1,875% this year, with public companies now holding $647 million in exposure. The latest player? Biotech firm iSpecimen, which announced a $200M SOL investment. CEO Rob Lim cited Solana’s “dual value proposition” of price appreciation and staking yields (currently ~7%). This mirrors moves by Upexi and Neptune Digital Assets earlier in 2025. Institutional flows could be the catalyst SOL needs to breach $200 resistance.
Solana’s Make-or-Break Technical Pattern
A head-and-shoulders pattern has dominated SOL’s daily charts, with its neckline at $160. Analyst Melikatrader notes two scenarios: (1) a breakdown below $160 triggering a 15–20% drop, or (2) a fakeout rally toward $219 if buyers defend the trendline. The ascending channel (higher highs/lows since June) leans bullish, but traders should watch volume—breakouts without conviction often reverse. Personally, I’d wait for a close above $185 with RSI (currently 57.63) avoiding overbought territory.
| Indicator | Value |
|---|---|
| Current Price | $181.56 |
| 20-Day MA | $178.36 |
| Bollinger Upper Band | $202.01 |
| Projected Target | $219.00 |
Key Takeaways for SOL Traders
1.Corporate demand could offset retail selling pressure.
2.MACD, RSI, and volume patterns favor bulls—for now.
3.A drop below $160 invalidates the bullish thesis. Set stop-losses accordingly.
Solana Price Prediction FAQs
What’s driving Solana’s price surge in 2025?
Three factors: institutional treasury allocations (like iSpecimen’s $200M bet), bullish technical setups (ascending channel, MACD crossover), and staking yields attracting capital from low-risk investors.
Can SOL reach $219 in 2025?
If SOL breaks $202 resistance (upper Bollinger Band) with volume, the measured MOVE from its head-and-shoulders pattern suggests $219 is achievable. However, macroeconomic risks (e.g., Fed rate hikes) could delay this.
Is now a good time to buy Solana?
From a technical standpoint, SOL’s position above the 20-day MA ($178.36) suggests upside potential. That said, wait for confirmation—either a close above $185 or a bounce off $160 support.
