BNB Price Surge: Binance Coin Targets $1,024 Breakout Milestone

BNB rockets toward key resistance level as bullish momentum builds.
Technical Breakout Imminent
Binance's native token flirts with the $1,024 threshold—a level that could trigger another massive rally. Market patterns suggest this isn't just another pump; the charts are screaming breakout.
Market Dynamics at Play
Trading volume spikes while traditional finance guys scratch their heads about 'digital gold'—meanwhile, crypto natives keep stacking gains. The pattern repeats: institutions eventually FOMO in after retail proves them wrong yet again.
Targets in Sight
Clear skies ahead if BNB smashes through that critical resistance. Next stop? Nobody's saying it out loud, but everyone's thinking it—previous ATH territory looks increasingly vulnerable.
Because nothing says 'sound investment' like volatile digital assets outperforming your boomer portfolio while Wall Street analysts still debate whether crypto is 'real.'

Analysts view the $1,007 level as a key starting point for the next leg higher, potentially opening the path to $1,024 if momentum holds. With strong historical utility backing the memecoin, the current breakout structure is gathering attention.
Chart Signals Renewed Strength Above Downtrend Line
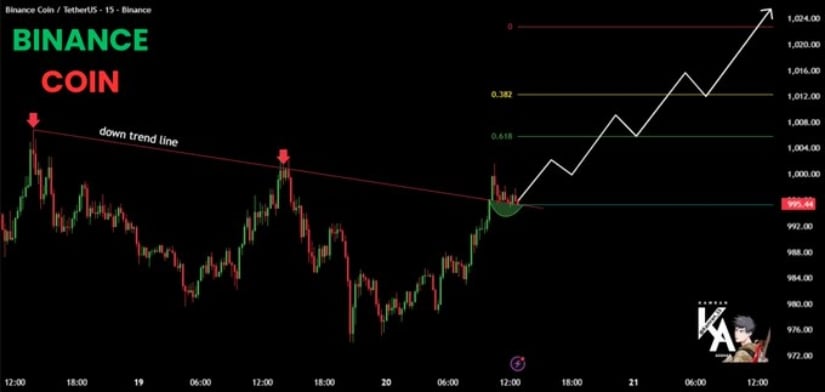
According to analyst Kamran Asghar, BNB has reclaimed strength after breaching the downtrend line, shifting market sentiment back in favor of buyers. The move aligns with higher time frame resilience, as the breakout coincides with Fibonacci retracement levels that indicate further upside potential. The price is currently consolidating NEAR $999, but momentum suggests that the $1,007 level could serve as the first significant checkpoint before continuation.
Source: X
The chart further illustrates a possible upward trajectory that respects the Fibonacci 0.382 and 0.618 levels as stepping stones toward higher targets. This technical alignment adds conviction to the bullish view, as reclaiming these levels typically signals broader market confidence. Volume activity also supports the breakout, with buying interest rising as the coin crossed above the resistance trendline.
Asghar emphasized that the coin’s long-term utility strengthens its market position beyond short-term speculation. The projection toward $1,024 reflects not only the immediate breakout pattern but also the broader confidence in the coin’s adoption and ecosystem. Should the price sustain above $1,007 and build higher lows, it could reinforce a bullish structure capable of unlocking further gains in the sessions ahead.
Market Data Underscores Stability at Higher Levels
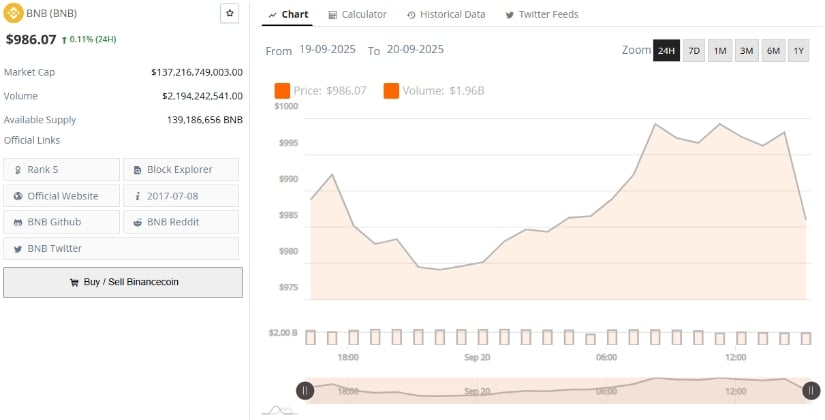
According to BraveNewCoin, BNB was trading at $986.07, reflecting a modest 0.11% gain over the past 24 hours. The coin holds a market capitalization of $137.21 billion, maintaining its position as the fifth-largest cryptocurrency by overall valuation. Trading volume over the same period reached $2.19 billion, pointing to healthy liquidity levels that continue to support active participation across exchanges.
Source: BraveNewCoin
The circulating supply currently stands at 139.18 million tokens, reinforcing its scarcity factor relative to its broad utility within the Binance ecosystem. This combination of steady price action, strong capitalization, and consistent market activity reflects a stable foundation, even as the broader crypto market undergoes fluctuations. Such resilience continues to frame the asset as one of the more established assets in the digital economy.
Indicators Show Strength Near Key Levels
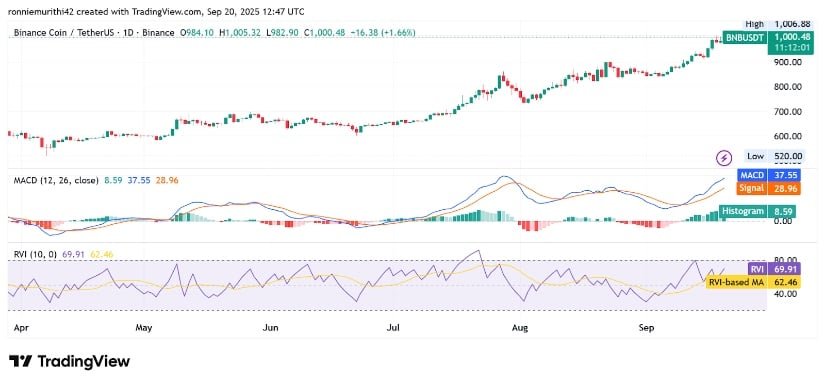
At the time of writing, BNB was trading at $1,000.22 after touching an intraday high of $1,006.88. The price continues to climb steadily, extending its breakout momentum from earlier in the week.
Source: TradingView
The MACD indicator highlights bullish momentum, with the MACD line at 37.53 staying above the signal line at 28.95, while the histogram shows positive values at 8.58. This suggests further upside pressure remains in play.
The RVI reading at 69.90, above its signal of 62.46, reinforces strength in the current trend. Both indicators suggest momentum remains intact as buyers dominate price action.
