Chainlink’s Cup and Handle Pattern Signals Explosive Breakout Targeting $30+

Chainlink just flashed its most bullish technical setup in years—and traditional finance is scrambling to catch up.
The Oracle Giant Awakens
LINK's classic cup and handle formation completed with textbook precision, breaking through resistance levels that had traders watching every tick. This isn't just another crypto pump; it's a technical masterpiece playing out in real-time.
Breaking the $30 Barrier
Price action doesn't lie—unlike some Wall Street earnings reports. The breakout above $30 wasn't just a psychological barrier; it was a declaration that institutional adoption is here to stay. Smart money's stacking LINK while traditional funds still debate whether crypto is 'real.'
Oracle Dominance Continues
Chainlink's securing more partnerships than a investment banker at a conference—except these integrations actually create value. The network effect is accelerating while legacy systems struggle with paperwork and compliance meetings.
Remember: technical patterns work until they don't, but this setup's too clean to ignore. Maybe the real cup was the friends we made along the way—but honestly, it's probably just about making money.

Bubbafox points to a long, rounded base and short handle NEAR the $25 resistance, signaling a possible rally toward $30 if buyers confirm a breakout with rising volume.
The 200-day moving average and mid-term trendline continue to hold, reinforcing bullish momentum above the $21–$22 support zone.
At the same time, LINK trades near $24.03, up 2.35% in 24 hours, with $16.28 billion market cap and $1.23 billion daily volume. Intraday charts show buyers defending $23.0–$23.5 support, while a decisive close above $23.95–$24.89 could extend gains. Sustained volume remains key for validating the breakout and driving further upside.
LINK Cup-and-Handle Pattern Near Completion
Chainlink is displaying a large cup-and-handle formation that may be close to completion, according to analyst Bubbafox. The pattern consists of a long, rounded base that forms the cup, followed by a shorter downward consolidation forming the handle. Historical market behavior often associates this pattern with potential upward price movement if the asset clears key resistance levels.
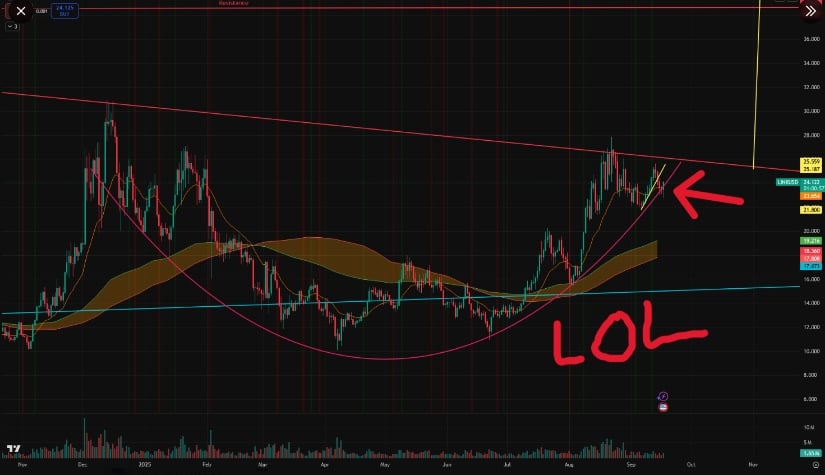
LINKUSDT Chart | Source:x
Bubbafox identifies the $25 zone as a critical level to surpass. The chart shows a long-term descending resistance line derived from previous highs that aligns near this level.
However, a decisive close above this resistance could open a path toward the $30 mark or higher if buying pressure strengthens. The structure suggests that a sustained move above $25 WOULD confirm the pattern and potentially initiate a new upward phase.
Support and Trend Indicators
Chainlink’s chart also reveals steady technical support. The 200-day moving average and a rising mid-term trendline remain intact, supporting the broader uptrend. Trading volume has maintained stable levels, reflecting consistent market activity around the key support range of $21 to $22. Maintaining this zone is considered essential for the continuation of the cup-and-handle setup.
Additionally, a breakout supported by increasing trading volume would further validate the bullish formation. Bubbafox notes that holding above the $21–$22 range is crucial for buyers to sustain momentum. Otherwise, any decline below these levels could delay the anticipated move, while a successful break above resistance might attract fresh interest from traders targeting a breakout beyond $30.
Short-Term Resistance and Key Levels
Additional analysis from ShardiB2 focuses on shorter time frames. Shardi B observes that the price action remains capped below $23.95, which now acts as a key short-term resistance. The asset has faced multiple rejections around this pivot, showing sellers’ activity during each attempt to advance.
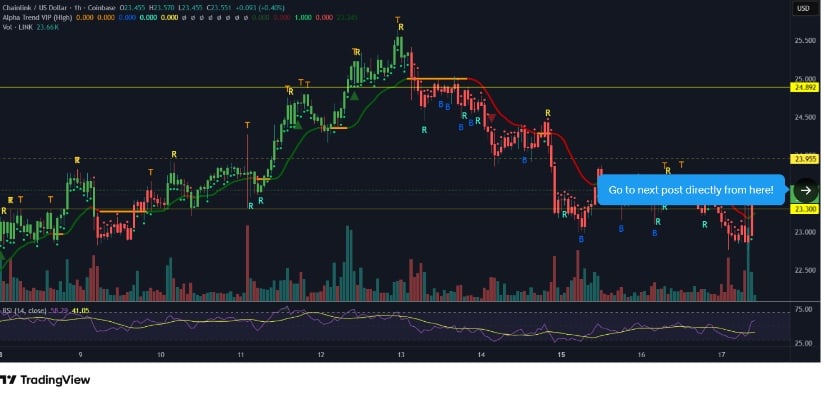
LINKUSD Chart | Source: x
Support near $23.30 has held firm, with buyers repeatedly defending the area. However, a close below this level may invite deeper pullbacks, while a rebound could lead to a retest of $23.95 and potentially $24.89.
Hourly momentum indicators such as the Relative Strength Index (RSI) fluctuate between 41 and 58, suggesting a neutral to mildly bearish trend without signs of oversold conditions. A strong hourly close above $23.95 would be necessary to restore near-term upside potential.
Market Performance and Trading Range
Chainlink price today is at $24 up 2.35% over the past 24 hours. Its market capitalization stands at $16.28 billion, with a daily trading volume of $1.23 billion and a circulating supply of approximately 678 million tokens. During the previous session, the asset moved from $23.1 to $23.5, briefly dipped to $23.0, and then rebounded above $24.0.
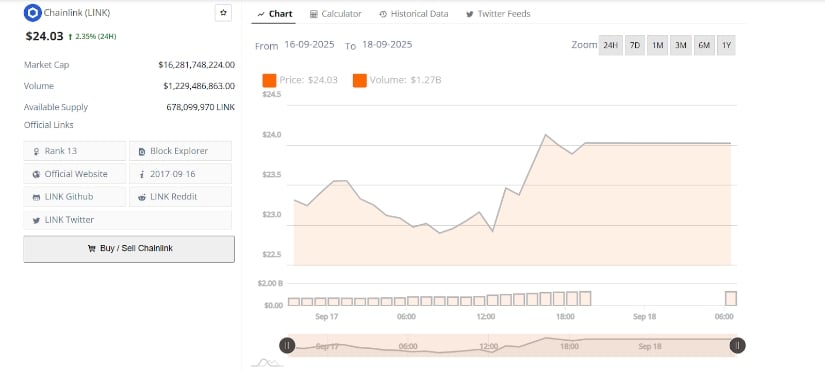
LINKUSD 24-Hr Chart | Source: BraveNewCoin
The price breakout above $24.0 coincided with increased trading volume, indicating strong market participation. This activity increases the likelihood of continued attempts to surpass upper resistance levels, with $ 24.50 acting as the next psychological barrier.
The intraday lows near $23.0 provide immediate support and will be closely monitored for potential retests. If buying momentum persists, the path toward $25 and beyond remains a key focus for market participants seeking confirmation of a larger breakout toward the $30 level.
