Optimism Price Prediction: Bottom Structure Formation Signals Imminent Bullish Reversal

Optimism's chart flashes bullish signals as bottom structure solidifies—traders eye potential breakout above key resistance levels.
Technical Analysis Breakthrough
Pattern recognition experts spot textbook bottom formation across multiple timeframes. The structure suggests accumulation phase completion, with whales positioning for next leg up.
Market Psychology Shift
Fear-dominated sentiment gives way to cautious optimism as buying pressure builds at support zones. Retail FOMO hasn't kicked in yet—typically the calm before the storm.
Institutional Whispers
OTC desk chatter indicates smart money accumulating positions while mainstream media still pushes bearish narratives. Classic divergence that usually precedes major moves.
Risk Management Essentials
Always remember: crypto moves fast in both directions. Potential recovery doesn't mean guaranteed moon mission—unless you're listening to those Twitter gurus selling courses.

Analysts point out that the recent resilience above demand zones could pave the way for a recovery move if momentum holds. At the time of writing, the asset trades NEAR $0.78 after gaining 6.06% in the last 24 hours.
Bottoming Structure Signals Accumulation Phase
Technical analysis shared on X by BullChain (@BullChain) highlights OP as an example of a bottom structure in development. The daily chart shows the token holding steady above support levels around $0.68–$0.75, with overhead resistance marked between $0.85 and $0.90.
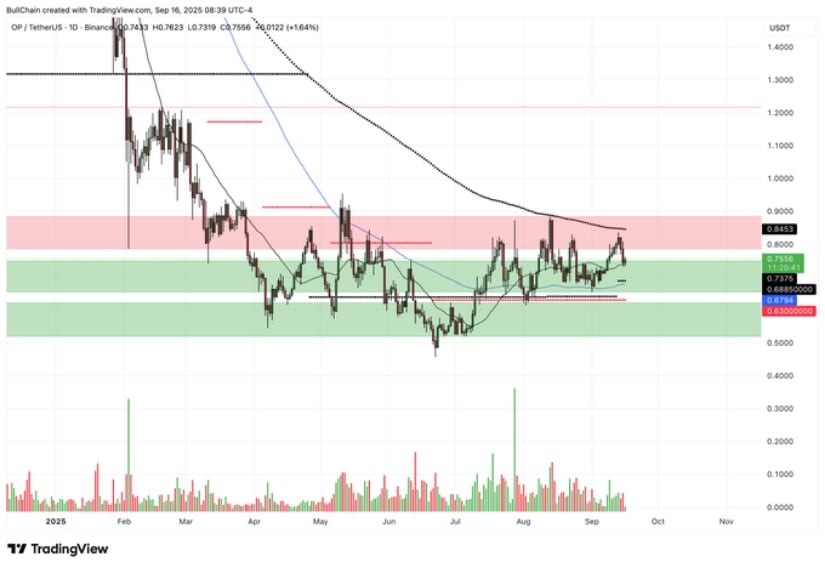
Source: X
This accumulation phase reflects a market in balance, with buyers gradually absorbing supply as sellers lose strength. A decisive break above resistance WOULD validate the bottoming thesis and open the door for a stronger upward move. Analysts suggest that a successful retest and breakout could lead to a sustained recovery phase, provided that trading volumes increase to confirm bullish conviction.
Until then, the asset continues to trade within its consolidation zone, with price structure showing the characteristics of a base-building stage, often a precursor to extended rallies.
Market Data Highlights Fundamental Position
According to BraveNewCoin, Optimism currently holds a market capitalization of $1.39 billion, ranking it 99th among all cryptocurrencies. Daily trading volume stands at $156.1 million, underlining steady liquidity for market participants. The token’s circulating supply is recorded at 1.77 billion tokens.
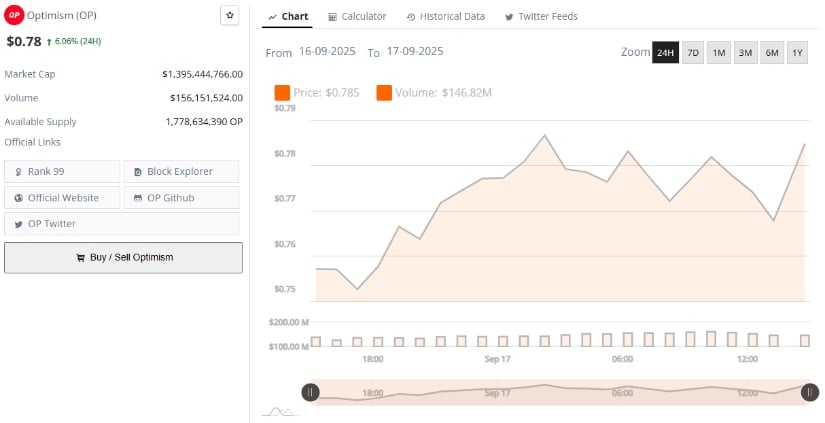
Source: BraveNewCoin
Market sentiment has stabilized following recent volatility, with the asset recovering from lows of $0.4570 to recent highs near $0.95. The current consolidation range is drawing attention as a battleground between buyers and sellers.
Holding above support levels strengthens the case for a bullish reversal, while failure to defend the zone around $0.68 could invite further downside pressure.
Daily Chart Indicators Point to Cautious Optimism
On the TradingView daily chart, OP trades at $0.7677, with momentum signals leaning cautiously bullish. The MACD line (0.0152) remains above the signal line (0.0124), supported by a positive histogram reading of 0.0028, suggesting buying pressure is gradually building.
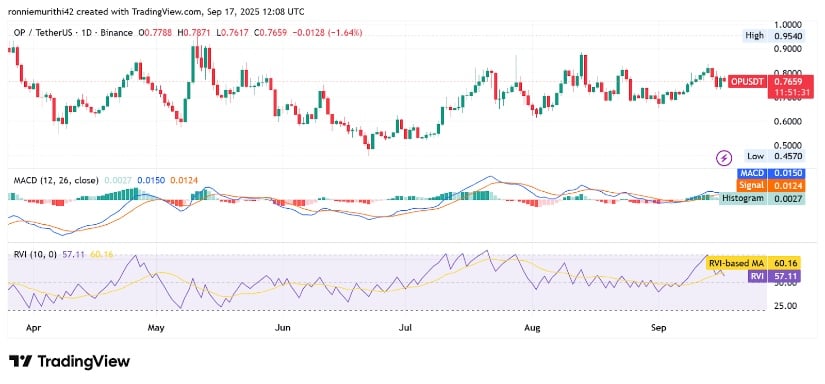
Source: TradingView
The Relative Vigor Index (RVI) prints 57.13, slightly below its moving average of 60.16. This reading indicates balanced market sentiment, with buyers holding a modest advantage but not yet commanding full control.
Together, these technical signals suggest that the asset may be in the early stages of recovery. A confirmed breakout above the $0.85–$0.90 resistance range would provide stronger evidence for a trend reversal, potentially positioning the token for a broader MOVE higher. Until then, consolidation within current ranges continues to form the foundation for what could evolve into a longer-term bullish structure.
