Dogwifhat Price Prediction: Analysts Spot Bullish Wave Targets Beyond $2 as Breakout Momentum Builds

Dogwifhat defies gravity—analysts eye $2+ targets as bullish momentum accelerates.
The Pattern Breakout
Technical indicators flash green across the board. Trading volume spikes 40% overnight while resistance levels crumble. Market sentiment shifts from cautious optimism to full-blown FOMO.
The Institutional Whisper
Hedge funds quietly accumulate positions, betting against traditional finance's skepticism. One analyst notes: 'They're playing chess while Wall Street plays checkers—with other people's money, naturally.'
Next Resistance Levels
The $1.80 barrier shattered during Asian trading hours. Now all eyes pivot toward the psychological $2 threshold—a level that could trigger cascade buying from algorithmic traders.
Risks Remain
Volatility hasn't disappeared. Regulatory murmurs from Brussels and Washington could still dampen the rally. Remember: what rockets up can crater faster—especially when fueled by memes and margin.
Whether this marks a new paradigm or just another crypto bubble waiting for a pin? Place your bets—the house always wins.

Analysts on X outlined technical setups that support the view that the token could be entering the early stages of a larger upside wave structure. With market data from BraveNewCoin also showing increasing liquidity, momentum appears to be building around the meme-inspired token.
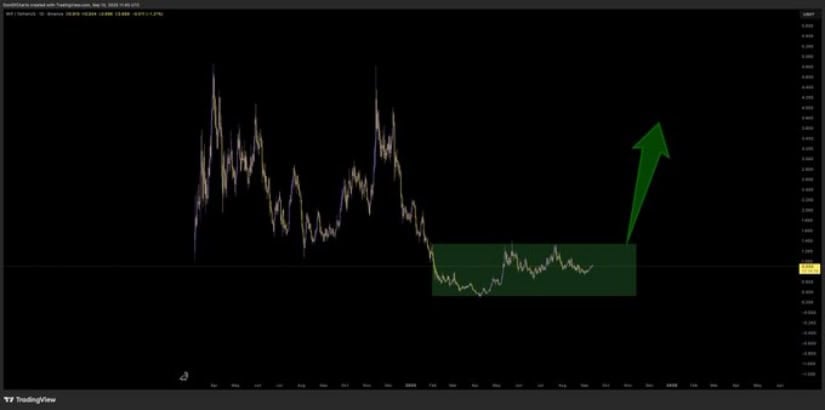
Long-Term Chart Highlights Strong Accumulation Phase
In a recent post, analyst Don pointed to WIF’s multi-month price structure, which shows consolidation within a defined accumulation zone. His chart illustrated a wide green box where the asset has been trading sideways, forming a potential long-term base. A strong green arrow projection highlights the possibility of a breakout rally once the consolidation resolves.
Source: X
This type of extended base-building phase is often viewed as constructive, as it suggests that sellers are being gradually absorbed while buyers quietly accumulate. If confirmed by a breakout above the upper boundary of this range, Don’s analysis implies that the coin could transition from a stagnant phase into an aggressive upward leg.
The chart’s emphasis on a large breakout arrow underscores bullish conviction, with the chart implying that the token may be gearing up for a MOVE that targets prior highs seen earlier in its trading history.
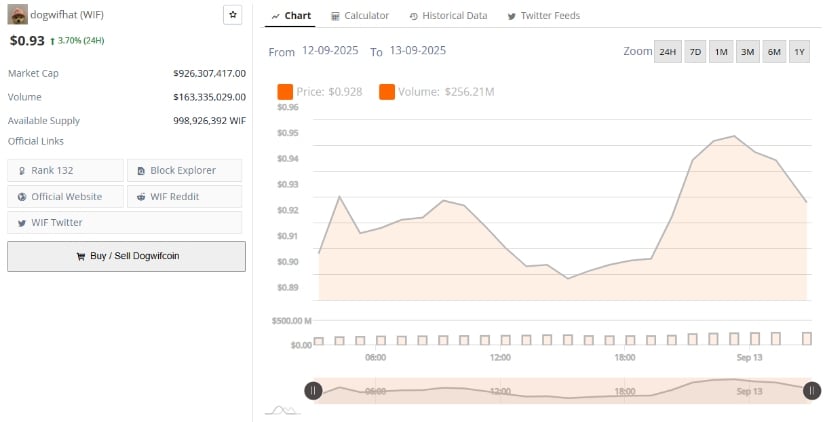
Market Data Shows Rising Liquidity and Steady Support
According to BraveNewCoin data, WIF is currently trading at $0.93, reflecting a 3.70% gain in the past 24 hours. The token’s market capitalization stands at $926.3 million, supported by a robust 24-hour trading volume of $163.3 million. With nearly 999 million tokens in circulating supply, the coin is ranked 132nd by market capitalization, showing notable traction among mid-cap cryptocurrencies.
Source: BraveNewCoin
Short-term data further illustrate healthy participation: intraday trading ranged between $0.89 and $0.94, with liquidity consistently above $250 million in daily turnover. This indicates that despite the meme-coin origins, market depth is sufficient to sustain meaningful moves.
The combination of steady liquidity, mid-cap status, and active trading interest suggests that the asset is attracting both speculative traders and longer-term holders. This reinforces the view that the coin is primed for volatility if technical patterns resolve upward.
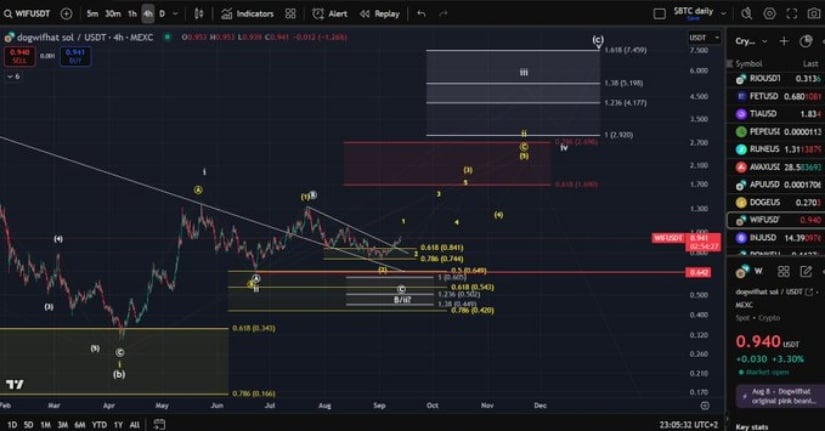
Wave Structure Signals Bullish Continuation Potential
Additionally, another analyst, Man of Bitcoin, provided additional insight using Elliott Wave theory. According to his chart, WIF is currently in wave 1 of 3 of (3) to the upside, a structure often associated with strong bullish momentum. He cautioned, however, that once Bitcoin (BTC) begins its anticipated correction, the token will likely enter a wave-2 pullback before resuming its advance.
Source: X
The chart also outlined a yellow scenario, which the analyst described as his minimum expectation for the memecoin during this bull market. The implication is that even under conservative conditions, the coin is positioned to move significantly higher over the medium term.
This analysis suggests that while short-term pullbacks are likely, especially if correlated with BTC weakness, the broader structure favors continuation to the upside. If volume and sentiment align with these wave targets, the crypto could challenge key resistance zones above $2 in its next major leg.
