Uniswap Price Battles Below Critical Averages—Traders Brace for $9 Support Showdown

Uniswap's price can't catch a break—stuck below key moving averages as the entire market holds its breath. Traders are laser-focused on that make-or-break $9 support zone. Will it hold or fold?
The Technical Pressure Cooker
Every chartist's nightmare: UNI keeps getting rejected at those pesky averages. No bullish momentum in sight—just a slow grind toward the danger zone. Exchange flows suggest whales are getting nervous.
Support at Stake
That $9 level isn't just a number—it's the last line of defense before things get ugly. Break below that and suddenly everyone remembers why they hated altcoin season in the first place. Classic crypto—promising decentralization but delivering heartburn.
Nobody's placing big bets until this plays out. Because nothing says 'mature asset class' like watching digital tokens play limbo with critical support levels while traditional finance snickers from the sidelines.

Recent price action points to a potential test of the $9 support area, a key horizontal level that traders are closely monitoring. Volume patterns and technical indicators together suggest distribution, warning of possible further downside unless a clear rebound is confirmed.
Price Setup Reflects Rounding-Top Formation and Resistance Levels
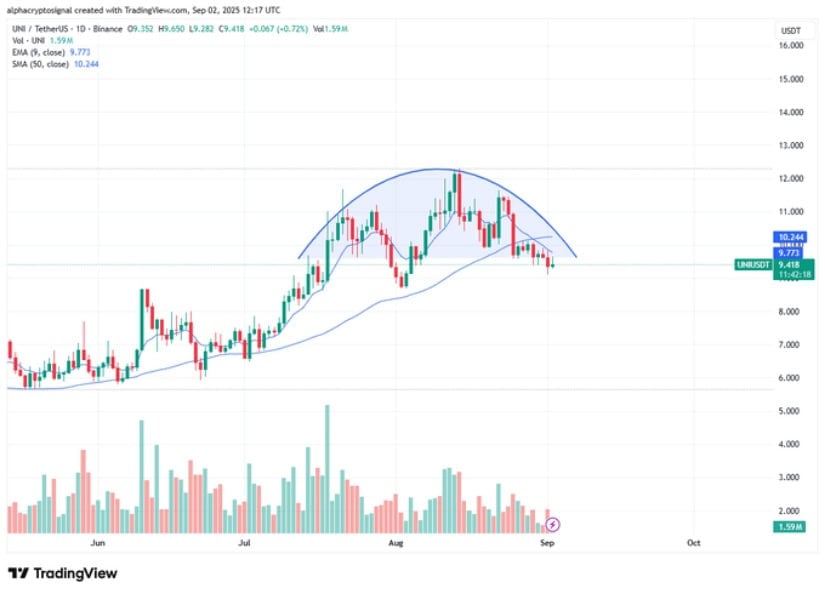
The daily price structure forms a distinct, rounded top pattern, with the swing high NEAR $12.30 followed by a sequence of lower highs into early September. Currently, the price sits under both the 9-day exponential moving average (EMA) at approximately $9.77 and the 50-day simple moving average (SMA) near $10.24. The shorter EMA has crossed below the longer SMA, signaling a shift from bullish momentum toward a neutral to bearish stance in the short term.
Source: X
Volume on rallies has been comparatively muted, with thinner green bars, while declines are accompanied by heavier red volume bars. This volume profile supports the interpretation of a distribution phase, where selling dominates and buying interest remains subdued.
Immediate horizontal support lies around $9.00, marked by recent swing lows and the current test area. Should this support break with increased selling volume, the next notable demand zone lies between $8.20 and $8.50, a consolidation region from mid-year.
On the upside, resistance bands extend across the $10.20 to $10.50 zone, centered on the 50-day SMA, with a stronger supply near the $12.00–$12.30 range forming the peak of the previous rally.
Intraday Price Action and Volume Reflect Choppy, Range-Bound Trading
Data from intraday metrics reveals that UNI price has been fluctuating tightly between roughly $9.30 and $9.60, with the 24-hour volume holding at an estimated $323 million to $341 million. These volumes indicate strong liquidity, enabling large trades without excessive slippage. However, the intraday price trace shows jagged, repetitive peaks and troughs, characteristic of algorithmic and market-maker activity absorbing orders within a narrow band.
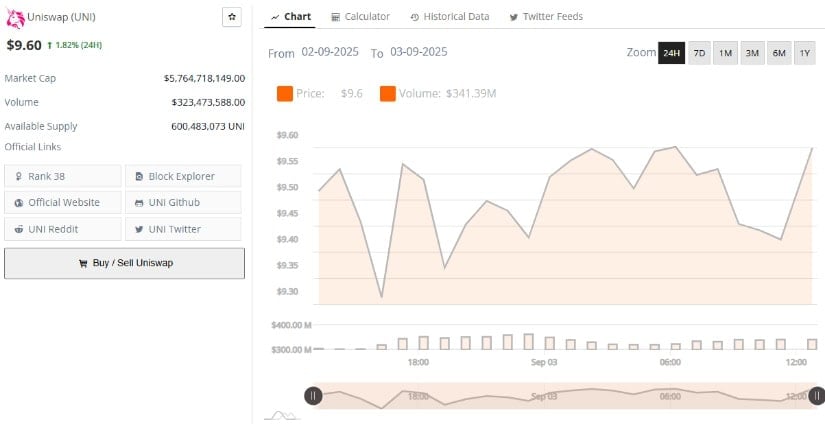
Source: BraveNewCoin
This microstructure suggests current trading largely reflects distribution or neutral rebalancing rather than strong accumulation. Immediate intraday support is tested near $9.30, with resistance forming around $9.60 to $9.65. A clear breakout on high volume beyond these levels is likely to dictate the near-term price direction, either challenging the $10.00 zone on the upside or retesting the $9.00 floor.
Short-term traders can capitalize on range-bound movement with tight stops, while swing traders should wait for more definitive volume-backed moves. Market participants are advised to monitor broader influences such as major cryptocurrency trends and macroeconomic news, which can quickly resolve intra-day indecision.
Momentum and Money Flow Indicators Signal Bearish Bias
At present, the daily MACD reading stands at -0.219 with the signal line at -0.076 and a negative histogram of -0.143, illustrating active bearish momentum. The MACD line remains below the signal line, underscoring selling pressure.
The Chaikin Money FLOW (CMF) indicator reflects a value of -0.06 over the 20-day lookback, implying consistent net capital outflows. Price has rolled off the mid-August highs near $12.30 down to approximately $9.40, aligning with these technical signals pointing toward distribution and seller dominance.
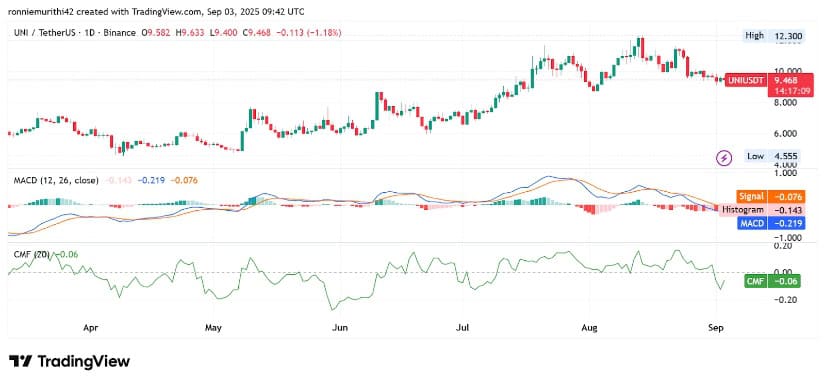
Source: TradingView
While the MACD histogram shows slightly shrinking red bars, suggestive of potential momentum easing, this alone does not confirm a bullish reversal. Similarly, a brief uptick in CMF remains below zero, indicating ongoing net selling despite minor influxes on price bounces.
For a credible shift toward bullishness, traders WOULD look for the MACD to cross above its signal line with a green histogram, and CMF to move above zero, preferably above +0.05, accompanied by rising daily volume. Without these, the current indicators favor caution.
