Bitcoin Bulls Charge Toward $112K as Gold Hits Fresh Records – But Can This Rally Last?

Digital gold meets the old guard—and both are flashing green.
Bitcoin's relentless surge pushes toward the $112,000 mark while gold notches another all-time high. Traders cheer, skeptics sweat. But beneath the euphoria, questions loom.
Is This a Macro Breakout or Just Another Bubble?
Momentum drives crypto. Fear fuels gold. Yet both rallies share one thing: a deep distrust in traditional finance. Central banks print, investors pivot. Simple—until it isn’t.
Institutional money floods Bitcoin ETFs. Gold gets a safe-haven bid. Everybody’s a genius in a bull market. (Just ask the guys who still think leverage is a free lunch.)
When the music stops, not everyone grabs a chair. Gold’s got millennia of cred. Bitcoin’s got… well, a 15-year streak of proving purists wrong.
So, does the rally last? Maybe. Until the next ‘unforeseen’ macro shock—or some regulator finally reads the fine print.

At Tuesday’s Wall Street open, Bitcoin surged nearly 2% on the day, hitting $111,775 on Bitstamp. The move mirrored gold’s breakout, which was triggered by last Friday’s U.S. macro data. Together, BTC and XAU punished short-sellers: CoinGlass data shows crypto traders lost around $60 million in liquidations within four hours.
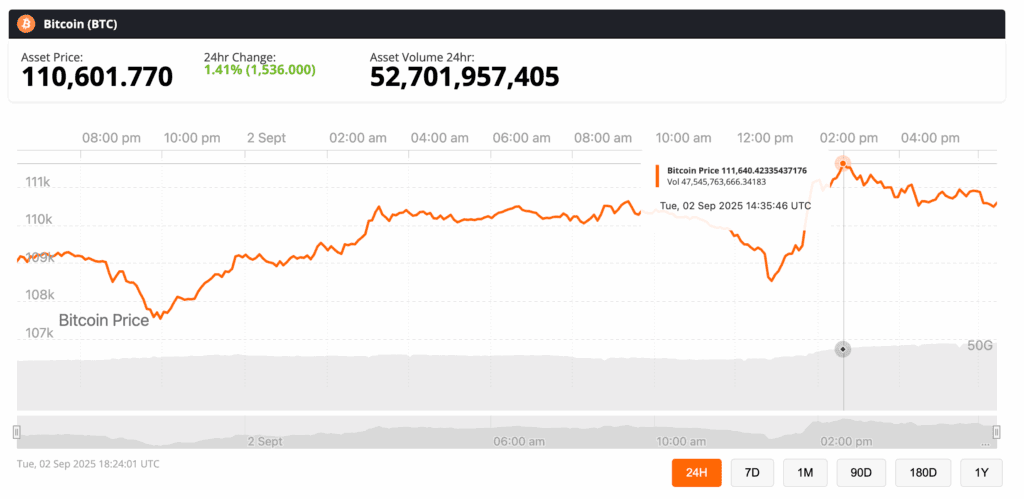
Bitcoin has since pulled back to $110,000, Source: BNC
The $100K Elephant in the Room
Despite the pump, bearish signals linger. Rekt Capital described the moment as “critical,” highlighting heavy bearish candles and warning that BTC could slip out of its uptrend channel. Others are more bearish again with a view that $112K has now become resistance and that a $100K retest looks inevitable “in the coming days.”
The harsher view: if $100,000 falls, the current bull market could be over. That’s the uncomfortable truth hovering over every candle right now.
September: Bitcoin’s Bogey Month
September is historically terrible for Bitcoin. Since 2013, BTC has averaged a 3.5% loss in September, and week three has been a near-guaranteed red zone. If history rhymes, this rally could be a bull trap dressed in gold’s glitter.
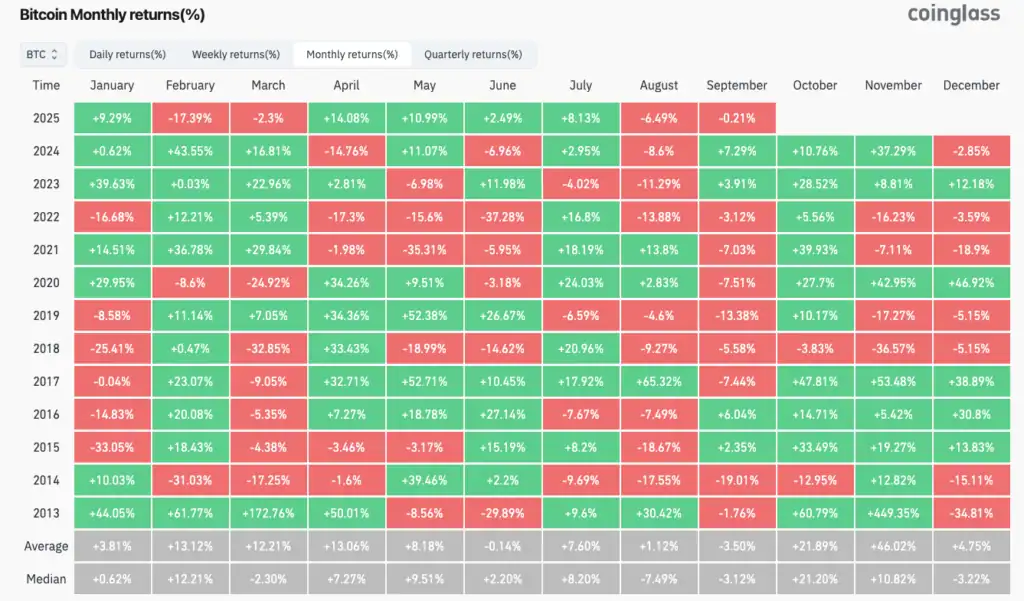
Bitcoin Seasonality is not great for September.
On-Chain Signals Split the Crowd
Still, not everything screams doom. Glassnode data shows Bitcoin’s Cost Basis Distribution clustering tightly around current price levels—a sign of strong spot-market conviction, especially compared to Ethereum’s weaker flows. That density often provides real support versus the froth of futures-driven moves.
Exchange flows add intrigue. Coinbase just recorded netflow spikes from Aug. 25–31 after hitting its lowest 30-day SMA since early 2023. Meanwhile, Binance saw netflow highs in late July and late August—both levels historically tied to reaccumulation. In other words, smart money may be quietly shifting reserves in preparation for upside.
Long-term holders are taking some profits, but activity is modest compared to past peaks—measured distribution, not panic selling.
The Line in the Sand: $113,650
Technically, the battle is clear. bitcoin must decisively close above $113,650 to confirm a bullish break and erase the descending trendline. That would open the door to $116,300, $117,500, and maybe even $119,500.
But if the breakout fails, downside targets remain brutal: the $105,000–$100,000 order block.
Contrarian Take: Gold Is the Tell
Here’s the twist: Bitcoin isn’t leading this rally—gold is. And gold’s new highs reflect investor panic about fiat debasement and shaky macro policy. If Gold keeps ripping, Bitcoin can ride the sympathy wave. But if gold stalls, Bitcoin could be left standing at $112K with no chair when the music stops.
So, is this Bitcoin showing strength, or just acting like “gold with more beta”? The next few candles—and gold’s ability to hold above $3,500—will decide.
