Hedera Price Action Signals Bullish Setup as Analysts Outline Final Wave - Here’s What’s Next
Hedera's chart just flashed the pattern traders live for—and analysts say the final wave could send shockwaves through the crypto markets.
The Technical Breakout
HBAR's recent momentum isn't just noise. It's carving a textbook bullish formation that's catching institutional attention. The setup suggests we're approaching the culmination of a multi-phase rally—one that could redefine resistance levels.
Market Mechanics in Play
Volume confirms the move. Liquidity pools are shifting, and open interest screams conviction. This isn't retail FOMO—it's smart money positioning for the next leg up. The network's enterprise adoption narrative fuels the technical case, creating a rare fundamentals-meets-momentum scenario.
The Final Wave Thesis
Analysts point to historical fractal similarities and Fibonacci extensions that project a decisive upside target. If momentum holds, we're looking at a potential paradigm shift in HBAR's valuation framework. Of course, in crypto, even 'sure things' have a habit of humbling the overleveraged—because nothing makes trad-fi bankers sweat like an asset that refuses to behave like bonds.

After a strong 100% recovery from its key blue entry level, the token is now consolidating within a tight range around $0.24.
This movement highlights both the strength of its recent rally and the caution present at critical resistance levels. Analysts, including Hov and Steph Is Crypto, suggest the altcoin is forming a decisive wave structure that could dictate its next major move.
Market dynamics show consolidation patterns mirroring past bullish cycles, where accumulation often precedes explosive breakouts. With a market cap above $10 billion and consistent trading activity, the asset remains highly liquid. Technical signals and wave counts suggest that breaking above immediate resistance could unlock significant upside potential, making this a crucial phase for investors.
HBAR Shows Recovery Momentum After Key Retest
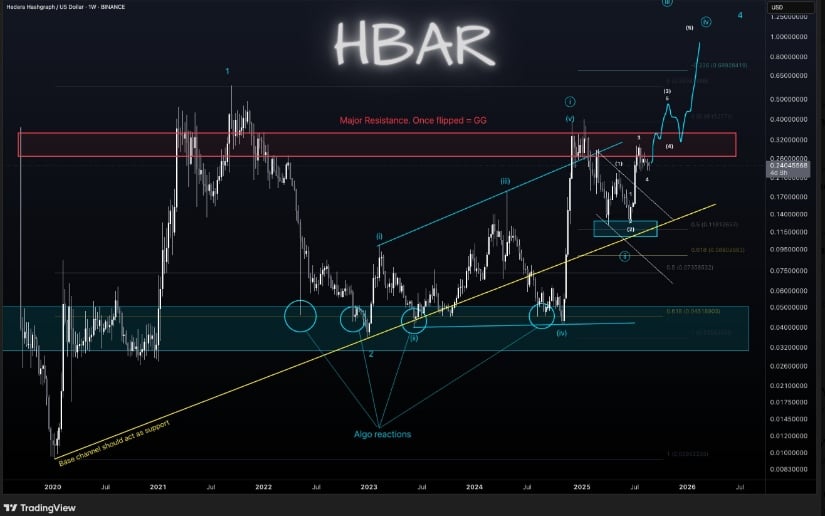
Hedera Hashgraph has displayed strong recovery momentum following a retest of its previously marked blue entry level. According to analyst Hov, the token surged more than 100% from that point, confirming renewed market strength.

HBARUSD Chart | Source:x
Hov explained that the current movement has completed three distinct waves from the low, a stage often seen as early in broader market cycles. For the uptrend to mature, further structural development is required. The analysis indicates that Hedera is possibly forming a fourth wave within a larger third-wave framework.
Resistance Levels Shape Short-Term Outlook
Hov emphasized that for this scenario to remain intact, it must push decisively above its immediate resistance zone. A confirmed breakout in a five-wave structure WOULD strengthen the case for further upside momentum. Such a move could open the path for extended gains in the coming sessions.
Despite the broader bullish structure, caution remains around resistance levels. Hov noted that these areas are not ideal for initiating new long positions while only three waves are visible. Instead, retests at lower levels may provide more favorable entry points for traders who are monitoring the trend.
Analysts Indicate Possible Final Wave Formation
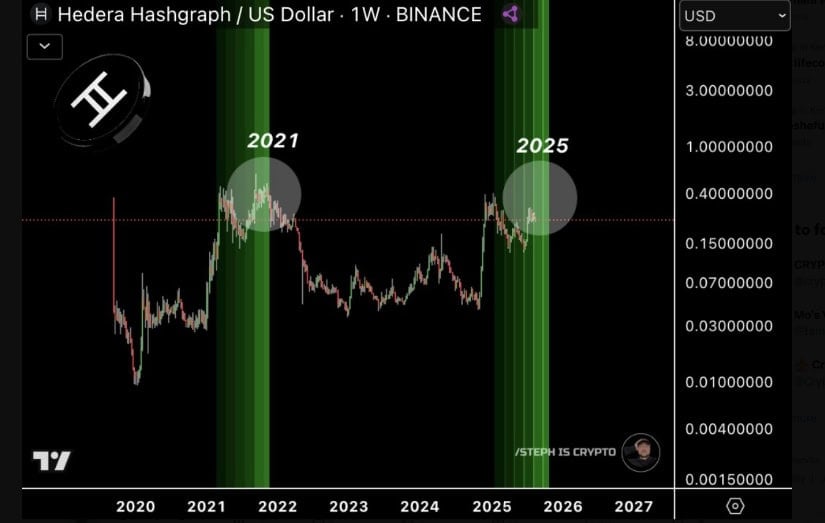
Analyst Steph Is crypto stated that the asset may be entering its final wave of the cycle. This wave could resemble the 2021 rally, which delivered exponential growth after prolonged accumulation phases. By comparing current patterns with the 2021 structure, the analyst suggested that 2025 could be marked by a strong breakout.

HBARUSD Chart | Source:x
The analysis described this setup as a repeating cycle of accumulation, breakout, and rapid expansion. If confirmed, it could see an extended surge during this stage, with early investors positioned to benefit if the token maintains its trajectory. The structure aligns with broader altcoin cycles where liquidity shifts from Bitcoin into alternative assets.
Market Conditions Indicate Consolidation
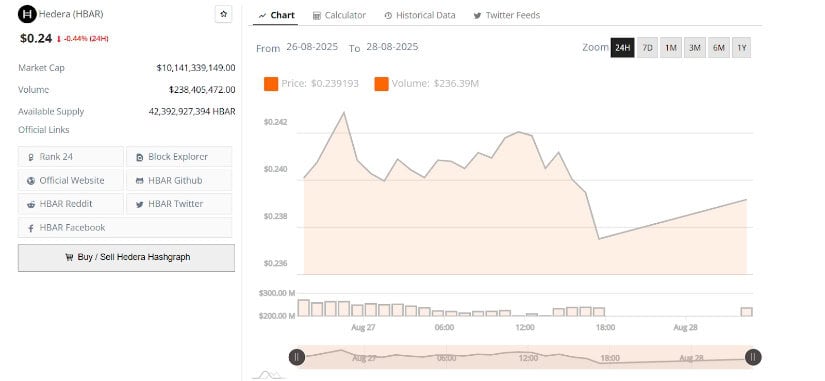
The altcoin has traded within a narrow range during the past 24 hours, moving between $0.238 and $0.242. This sideways pattern indicates market consolidation after recent upward movement. The price touched $0.242 before retracing toward $0.238 as selling pressure briefly increased.

HBARUSD 24-Hr Chart | Source: BraveNewCoin
Trading volumes have remained consistent, with activity rising during upward moves and easing during consolidation. This suggests cautious bullish sentiment as buyers accumulate at lower levels but face challenges breaking through higher resistance points. Market data shows the token with a capitalization above $10.14 billion and a daily volume of $238 million.
Technical Setup Supports Cautious Optimism
The market recorded a modest decline of 0.44% over the same period, signaling indecision in short-term direction. For sustained upside, buyers must maintain support around $0.24 and break resistance NEAR $0.242. Failure to do so could lead to further tests at lower levels.
Analysts agree that the technical setup signals potential for further upside. The alignment of wave structures and historical patterns with current trading activity presents a scenario closely monitored by traders. If momentum carries it beyond resistance zones, the price action could confirm the projected final wave, setting the stage for further expansion.

