Chainlink Defies Market Pressure: $30 Breakout Now in Clear Sight

Chainlink isn't just holding—it's priming for a major surge. Traders are eyeing that $30 threshold like hawks spotting prey.
The Resilience Factor
While traditional assets wobble under regulatory scrutiny and inflation fears, LINK stands firm. No fluff, no hype—just steady consolidation above key support levels.
Market Mechanics at Play
Oracle networks aren't just backend infrastructure anymore; they're becoming the backbone of decentralized finance. Chainlink's price action reflects that growing dominance—ignoring short-term noise while building momentum for the next leg up.
The Cynical Take
Wall Street still thinks 'blockchain' is a buzzword for PowerPoint presentations. Meanwhile, Chainlink actually moves value—without begging for permission from legacy finance gatekeepers.
Bottom line: When the breakout comes, it won't ask for permission either.

Technical charts reveal a multi-year consolidation within a symmetrical triangle, coupled with short-term market dynamics and momentum indicators that collectively outline a bullish setup, pending confirmation.
Long-Term Symmetrical Triangle Signals Build-Up for Breakout
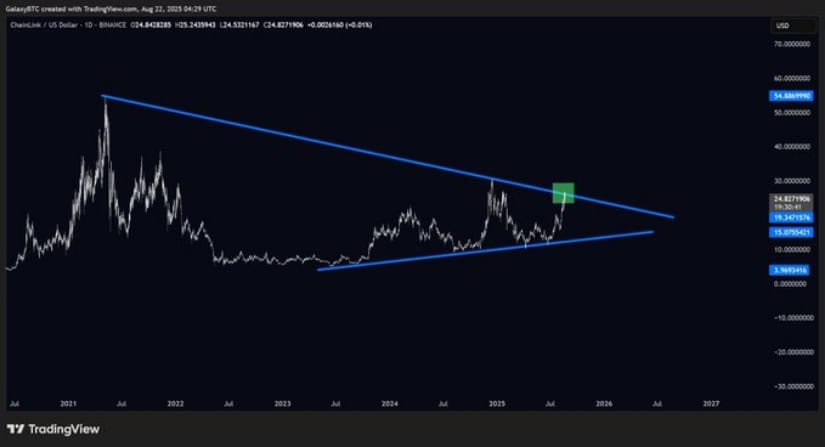
A long-term chart shared by Galaxy (@galaxyBTC) highlights the coin’s symmetrical triangle pattern extending back to 2021. Following a peak NEAR $55, the token entered a prolonged phase of lower highs and higher lows, compressing price action into a tightening wedge. This pattern represents years of accumulation and market compression often preceding decisive moves.
Source: X
Currently, LINK is testing the upper boundary of this triangle, reflecting resilient buying interest despite broader market softness. Galaxy emphasizes cryptocurrency strength during recent dips, indicating relative outperformance compared to many altcoins.
Should the memecoin break above this resistance trendline, a sustained rally toward $30–$35 could materialize, contingent on supportive volume. Conversely, failure to breach this barrier could prolong consolidation into 2026, making this resistance zone critical for the token’s long-term trend.
Market Data Reflects Healthy Liquidity Amid Controlled Retracement
Additionally, BraveNewCoin’s 24-hour chart shows the asset trading at $24.82, down 3.67% following a recent rally to $26, where profit-taking caused a mild pullback. Despite the dip, the memecoin maintains a strong market cap of $16.79 billion and robust daily volume of $1.84 billion, underscoring active liquidity and investor interest.

Source: BraveNewCoin
Price fluctuated between $24.50 and $26.50 during the day, with buyers stepping in around $24.50 to prevent deeper declines. This controlled retracement signals confidence in LINK’s fundamentals as a leading decentralized oracle provider while reinforcing price floors supported by a circulating supply of 678 million tokens.
The market appears to be consolidating, with $25.50–$26.00 presenting near-term resistance crucial for a continuation of upward momentum.
Technical Indicators Show Momentum Favoring Bulls Amid Minor Pullbacks
On the other hand, the TradingView technical chart incorporates Bollinger Bands and MACD indicators, revealing that the asset is trading near $24.87, nestled between the Bollinger midline at $21.77 and the upper band at $28.19. This proximity to the upper band suggests bullish control alongside the possibility of short-term pullbacks due to overextension.

Source: TradingView
Recent price action includes a local peak at $26.89 before a mild decline. The MACD remains positive with the MACD line (2.04) above the signal line (1.84) and a green histogram, indicating sustained buyer momentum. Key support at the Bollinger midline ($21.77) acts as a critical level that, if defended, could drive price toward $28 and potentially $30. A drop below this level risks deeper retracement toward the lower band near $15.35, signaling a bearish shift.
Together, these insights point to Chainlink’s firm price stance amid accumulating bullish momentum. The $30 target enters focus as critical resistance approaches, with market participants keenly observing volume and momentum cues to gauge whether cryptocurrency can sustain this upward push or face renewed consolidation phases.
