OP Defies Gravity at $0.72 Support - But This Critical Trendline Blocks All Breakout Hopes

OP clings to its $0.72 lifeline while a brutal trendline resistance slams the brakes on any upward momentum.
The Standoff
Price action coils beneath a descending trendline that's repelled every breakout attempt since last week. Bulls keep defending that $0.72 support zone like it's their last line of defense—because it probably is.
Market Mechanics
Traders watch volume patterns for clues while leverage builds on both sides. Break below $0.72? That opens the trapdoor toward lower supports. Break above the trendline? Suddenly everyone remembers why they bought this thing in the first place.
Reality Check
Another day, another crypto asset trapped between technical levels while traditional finance guys smirk about 'digital gold' trading like a penny stock. Sometimes the charts really do tell the whole story.

Recent technical charts reveal a market caught between support and resistance, with price action consolidating NEAR $0.72 and a descending trendline putting a lid on upward moves. Traders looking for a breakout need to keep a close eye on key technical signals that could determine the token’s trajectory soon.
Chart Highlights Resistance at Descending Trendline
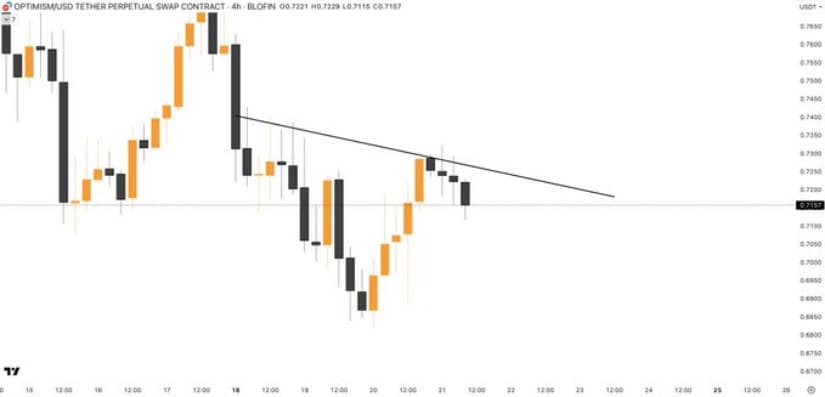
According to analysis by Shango (@ShangoTrades), the 4-hour chart shows OP consolidating just below a descending trendline, a clear indicator of short-term bearish control. Price action repeatedly fails to close above this resistance, limiting upside potential. Shango points out that a decisive candle close above this trendline could unlock gains toward the $0.74 to $0.75 range, aligning with important prior supply zones.
Source: X
However, without this breakout, the asset risks revisiting support between $0.69 and $0.70. Volume has thinned considerably compared to previous swings, raising concerns of a possible false breakout. Presently, the token is trapped in a compressed trading range, with uncertainty dominating until a clear directional MOVE emerges.
Market Data Shows Tight Range and Steady Volume
Market data from BraveNewCoin shows OP trading near $0.72 with a minor 0.47% decline over 24 hours and volume averaging $155 million. Such tight price action within the $0.71 to $0.72 band points to low volatility and subdued trading interest.

Source: BraveNewCoin
With around 1.75 billion tokens circulating and a market cap of roughly $1.25 billion, the token remains a mid-cap altcoin with solid liquidity. Its muted price response compared to wider market rallies suggests conservative demand.
Technical momentum lacks strength above $0.72, though volume spikes signal speculative trading. To confirm a bullish resurgence, daily volume WOULD likely need to ramp above $200 million, signaling broader market engagement.
Daily Chart Displays Consolidation Amid Mixed Technical Signals
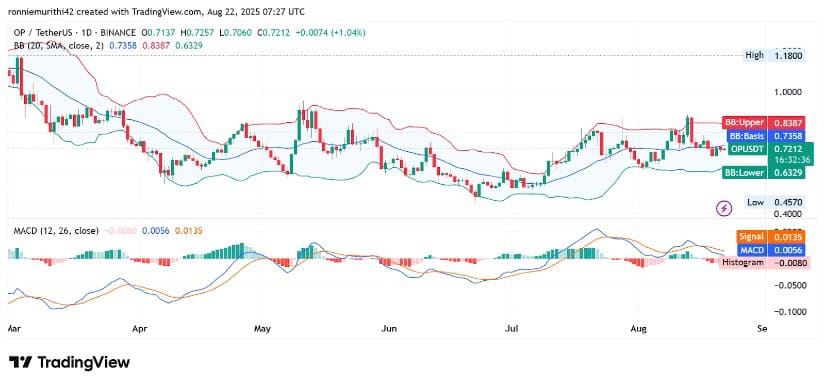
On a daily timeframe, TradingView charts illustrate price consolidation near the Bollinger Bands’ middle band at $0.7358, with wider bands between $0.83 and $0.63 indicating past volatility. The price stalling near the middle band reflects market indecision, showing a stalemate between buyers and sellers.
Source: TradingView
Momentum indicators provide further nuance. The MACD line hovers near the signal line, while the histogram sits slightly negative at –0.008. This setup reflects waning bearish momentum but no bullish confirmation. The memecoin structural pattern of higher lows since June indicates a developing base, yet repeated rejections at $0.74–$0.75 prevent a clear uptrend.
A consistent daily close above this region, accompanied by rising volume, is needed to validate bullish prospects. Otherwise, downside risk toward $0.63 remains valid.
Together, these charts portray a market balancing on a knife-edge. Cryptocurrency’s price holds firm near $0.72 but faces stiff resistance from the descending trendline and lackluster volume. Traders should look for rising volume and daily closes above $0.74 to confirm a breakout. Caution is warranted toward downside risks near $0.63 during this phase of indecision.
