Worldcoin (WLD) Eyes $0.50 as Triangle Formation Signals Potential Downturn

Technical patterns scream caution as Worldcoin's chart paints a worrying picture—that symmetrical triangle isn't just decoration.
Pattern Breakdown
WLD consolidates within converging trendlines, suggesting momentum's bleeding out. Volume drying up faster than a crypto influencer's credibility during a bear market.
Price Target Reality
The $0.50 level emerges not as hope but as a gravitational pull. Break below support, and that target becomes prophecy, not prediction—classic crypto math where 2+2 sometimes equals whatever the whales want.
Market Psychology
Traders eyeing this setup know the drill: triangles break, and they usually break hard. Whether it's a sigh of relief or a panic sell depends which side of the trade you're on.
Just another day in digital asset land—where technical analysis is either gospel or garbage, depending on how your portfolio's doing.

Technical analysis of recent charts shows the price fluctuating between key support and resistance levels, with volume and momentum indicators pointing toward a potential breakout. Traders should closely observe critical price points as the next major MOVE for the token takes shape.
Symmetrical Triangle Pattern Indicates Consolidation Phase
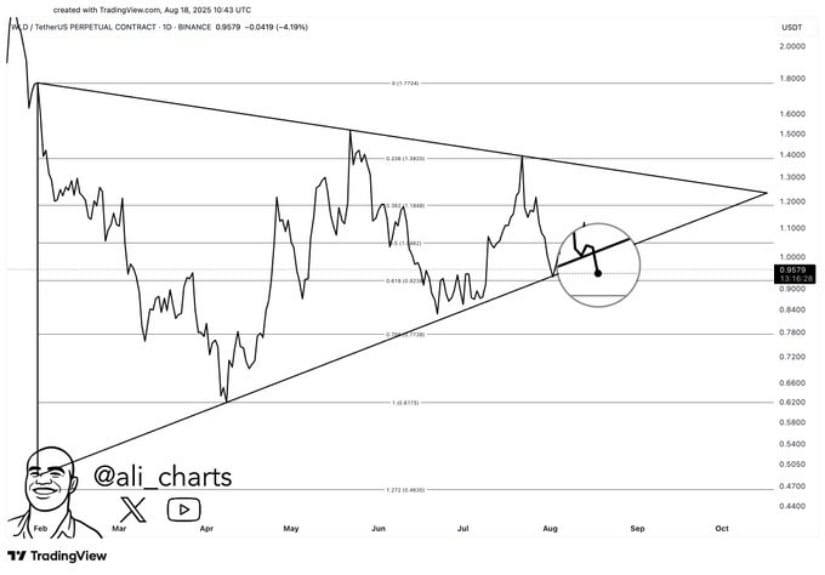
A chart shared by analyst @ali_charts depicts Worldcoin’s price moving within a narrowing triangle formation. This pattern is typical of consolidation phases preceding sharp breakouts. Support appears NEAR $0.75, while resistance lies close to $1. Price compression within the triangle signifies low volatility and market hesitation, as participants await a catalyst for a decisive directional move.
Source: X
Volume analysis confirms a decline during the consolidation, which aligns with usual triangle characteristics. Lower volume suggests anticipation rather than commitment, making an eventual breakout either to the upside or downside imminent.
A downward breakout could lead the asset toward the $0.50 level, which is near the triangle’s lower boundary and represents a significant bearish target. Conversely, breaking above $1 WOULD indicate renewed bullish momentum and could trigger further price advances.
Price Action and Volume Highlight Key Support and Resistance Testing
Additionally, BraveNewCoin’s chart provides a closer look at $WLD trading around $0.95, near critical support just below $1. The recent price has oscillated between $0.94 and $0.96, reflecting short-term volatility. A sharp dip to $0.90 followed by a modest recovery suggests market uncertainty and active contention between buyers and sellers.

Source: BraveNewCoin
Volume data reveals enhanced buying pressure near the $0.91 mark, implying attempts to defend support. This buying activity could help stabilize the price above key levels. However, sustained volume increases will be necessary to push prices past resistance and confirm renewed strength. Failure to maintain support may accelerate downside momentum.
Momentum Indicators Signal Bearish Sentiment in the Short Term
On the other hand, TradingView examines Worldcoin’s positioning against technical momentum indicators like BBPower and Chaikin Money FLOW (CMF). The BBPower indicator currently shows negative values, reflecting weak buying strength and supporting the view of potential price weakness.
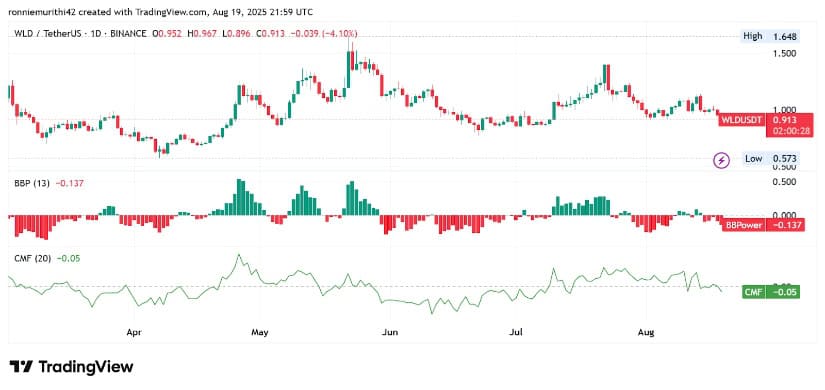
Source: TradingView
Likewise, the CMF is slightly negative, indicating that selling pressure prevails in the market at present. These conditions reinforce the bearish outlook suggested by the triangle pattern and volume trends. A confirmed break below $0.90 would likely validate this downtrend, making $0.50 the next probable target for the token.
The asset is navigating a crucial consolidation phase within a symmetrical triangle pattern, with key levels to watch at $1 for resistance and between $0.75 and $0.90 for support. Should the price breach below $0.90, traders may expect further declines targeting $0.50. Alternatively, a breakout above $1 could reverse current bearish sentiment and usher in a new bullish phase.
Given the mixed signals from price action, volume, and momentum indicators, market participants should monitor these levels closely for confirmation of trend direction. The coming sessions will be key in determining whether the token embarks on a downward correction or gains momentum for upward movement.
