Dogwifhat Primed for Explosive Rally: Symmetrical Triangle Signals $2 Breakout

Dogwifhat (WIF) is coiling up for its next big move—and traders are betting it’ll be to the upside.
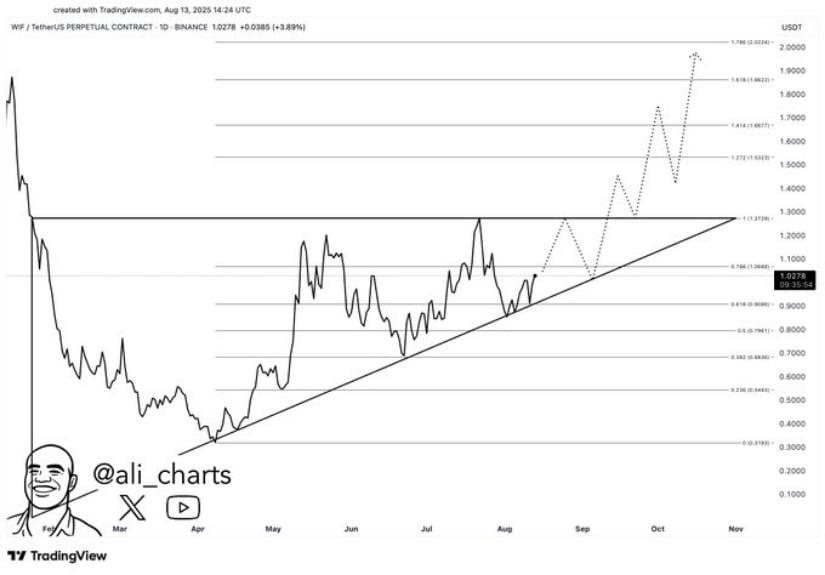
After weeks of consolidation, the meme coin has etched a textbook symmetrical triangle on its daily chart. The pattern’s tightening price action suggests an imminent breakout, with technicals pointing toward the $2 target.
Why This Matters
Triangle patterns are notorious for preceding volatile breakouts. For WIF, the setup arrives as Bitcoin stabilizes above $60K—a tailwind for altcoins. Retail traders are piling in, while degens whisper about a potential ‘meme season revival.’
The Flip Side
Not everyone’s convinced. Critics note WIF’s fundamentals (or lack thereof) and warn of ‘greater fool theory’ at work. Then again, since when did that stop crypto? One hedge fund manager quipped, ‘It’s not a bubble until the SEC sues it.’
What’s Next
A clean break above the triangle’s upper trendline could trigger algorithmic buying and FOMO inflows. But failure to hold $2? That’s when the ‘community’ starts blaming market makers.

Analysts are closely watching for a breakout above the triangle’s upper boundary, with projections pointing toward a target price of $2 if momentum holds.
Triangle Consolidation Signals Pending Breakout
The primary chart depicts $WIF’s price navigating within a symmetrical triangle—a classic market formation signaling indecision and balance between buyers and sellers. The narrowing of the triangle suggests that the breakout window is approaching soon.
Analyst Ali points out that the price has repeatedly respected the triangle’s support level, indicating strong buying interest at those points.
Source: X
If the price breaches the upper resistance line, the move toward $2 becomes highly probable, reflecting bullish sentiment among traders and investors. This breakout WOULD represent a significant uptrend continuation, potentially fueled by increased buying pressure from market participants anticipating the rally.
Nonetheless, caution is advised as a failure to break out cleanly or a false breakout could result in a pullback, forcing the price to retest lower support levels. The price behavior NEAR the triangle apex will thus be critical in determining whether the asset embarks on a bullish trajectory or faces renewed pressure.
Recent Price Volatility and Support Levels
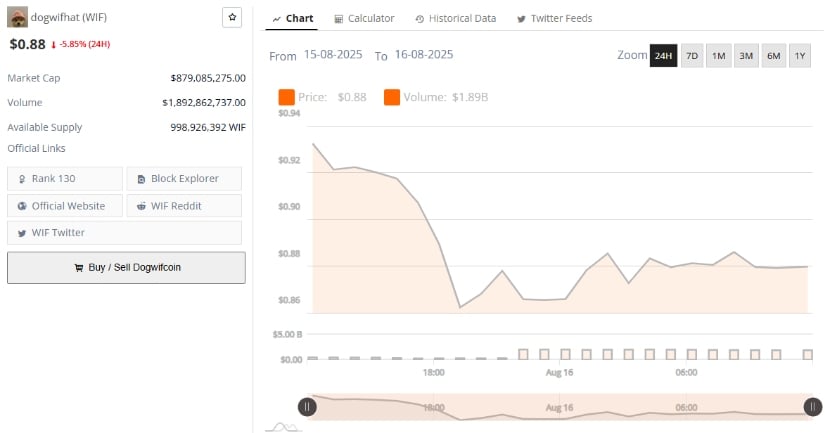
Recent price action charts reveal $WIF oscillating between $0.86 and $0.92, with a minor downtrend visible after failing to break the $0.92 resistance. At present, the token stands at around $0.88, reflecting a 5.85% decline over the last 24 hours. Moderate trading volume points to steady market participation without aggressive buying or selling swings.
Source: BraveNewCoin
The key resistance at $0.92 remains a hurdle, with traders uncertain if the token can sustainably push beyond this limit. The market capitalization remains robust, complemented by a significant 24-hour trading volume of $1.89 billion, signaling strong liquidity despite short-term price softness.
Traders are watching closely for the coin to hold support near $0.85. A breakdown here might lead to deeper retracement, but signs of reversal or strength above $0.90 could encourage renewed buying interest and set the stage for the anticipated breakout.
Technical Indicators Indicate Bearish Pressure but Potential for Reversal
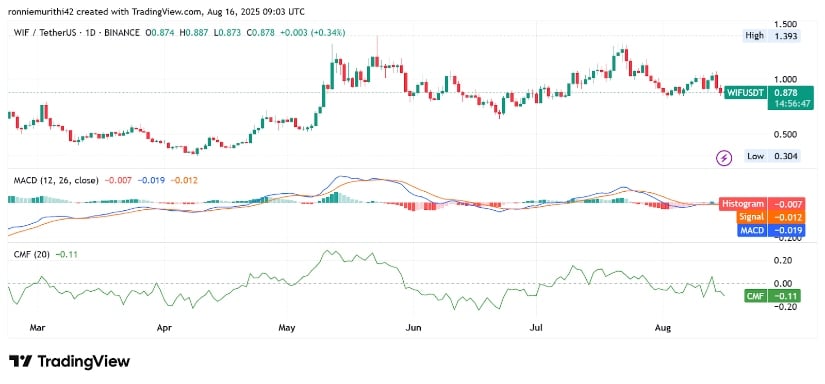
The technical picture via MACD and Chaikin Money FLOW (CMF) indicates a cautious near-term outlook. The MACD line remains below the signal line, accompanied by red histogram bars signaling prevailing bearish momentum. This aligns with recent selling pressure dominating price movements, underscoring continued weakness.
Source: TradingView
The CMF reading sits at -0.10, reinforcing concerns as it points to capital outflows and weak accumulation, suggesting limited support at current price levels. This combination contributes to a bearish bias, leaving room for further downside unless indicators turn positive.
Traders should monitor these momentum tools for potential shifts. A bullish MACD crossover or a rising CMF could signal improving market sentiment and provide early confirmation of a price reversal, possibly triggering the breakout that many anticipate.
