🚀 Litecoin (LTC) Price Prediction 2025: Is a Massive Breakout Imminent?

Litecoin’s chart is flashing bullish signals—but will the 'silver to Bitcoin’s gold' finally shine?
### The Setup: LTC Teases a Make-or-Break Moment
After months of sideways action, Litecoin’s price coils near a critical resistance level. Traders whisper about a textbook Wyckoff accumulation pattern. Meanwhile, institutional inflows creep up—because nothing says 'trust' like hedge funds chasing last cycle’s leftovers.
### The Catalyst: Halving Hype Meets ETF Mania
With the 2023 halving now baked into the price, LTC’s next move hinges on broader market sentiment. Bitcoin ETF approvals could drag altcoins up… or leave them gasping for relevance. Retail FOMO? Still MIA.
### The Verdict: A Pump Waiting for a Narrative
Technicals suggest upside potential—if Litecoin can break $150 and hold. But in a market where 'fundamentals' mean 'whatever Elon tweets today,' even Charlie Lee’s favorite project needs more than just a 'store of value' pitch. Watch the volume: no whales, no party.

With faster transaction time, higher circulating supply, and a different mining algorithm. But could this token be setting up for a massive breakout? Let’s dive into the charts.
Number of Transactions on Litecoin
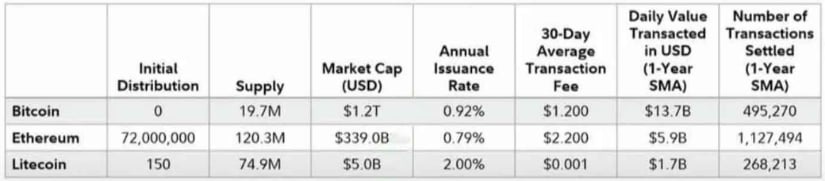
These metrics from 2024 show a clear divergence between Litecoin’s potential and the current market cap. Let’s not forget that Litecoin is one of the earliest tokens created after Bitcoin. The number of transactions that are being done on the Litecoin network is roughly half of the transactions that were done on the Bitcoin network. A higher number of transactions does not necessarily mean Litecoin moves more money or is more valuable; Bitcoin still dominates in transaction volume measured in USD and as a store of value. But it does show that the Litecoin blockchain is being used actively.
Litecoin Miner Sell-off & Network Growth
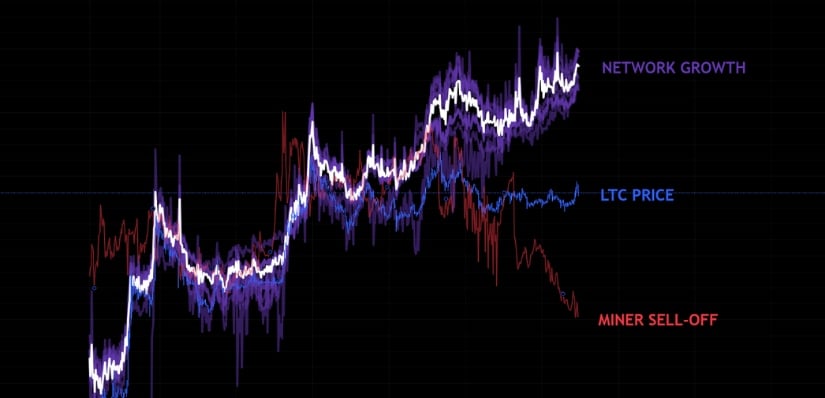
The network of Litecoin has been seeing a significant increase. Compared to previous times, this was often a precursor for rallies in the Litecoin price. Also, Litecoin miners have consistently been selling their mined tokens, which could potentially decrease the selling pressure on Litecoin. The Litecoin price, however, has been going sideways mainly in the past couple of years. Could it be time for Litecoin to start following the network growth? Let’s have a look at the technical structure.
Litecoin Technical Price Structure
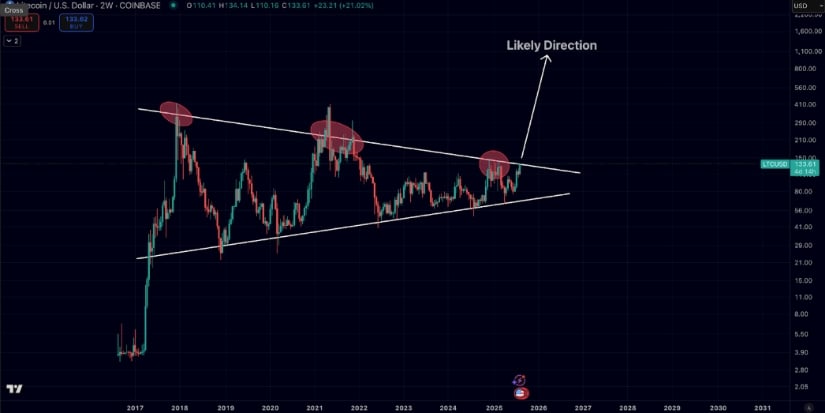
Litecoin has been forming a triangle formation since its exponential growth in 2017. Ever since, it’s just been consolidating in this massive 7-year triangle formation. This triangle formation could function as a continuation pattern, and therefore, the likely direction of this breakout WOULD be to the upside.
Moon Phases on Litecoin
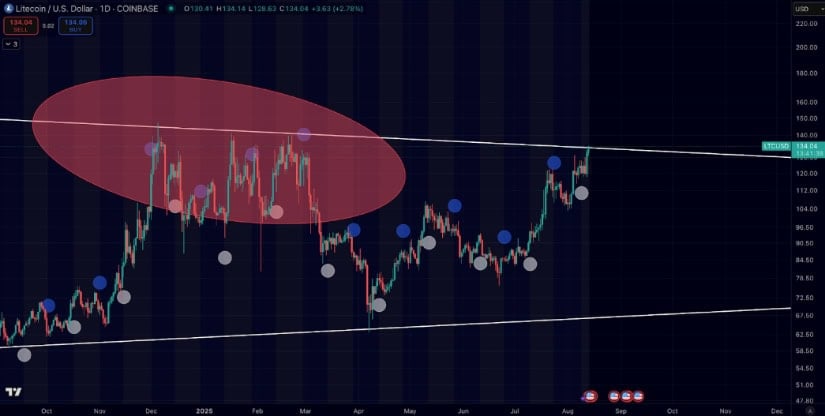
Some traders turn to unconventional methods to predict short-term price movements, one of them being moon cycles. Statistically, markets tend to have a higher probability of rising between a full moon (white) and the following new moon (blue). Right now, Litecoin is testing the resistance of a triangle formation, and we’re in the bullish moon phase. Could this be the signal for an imminent breakout in Litecoin?
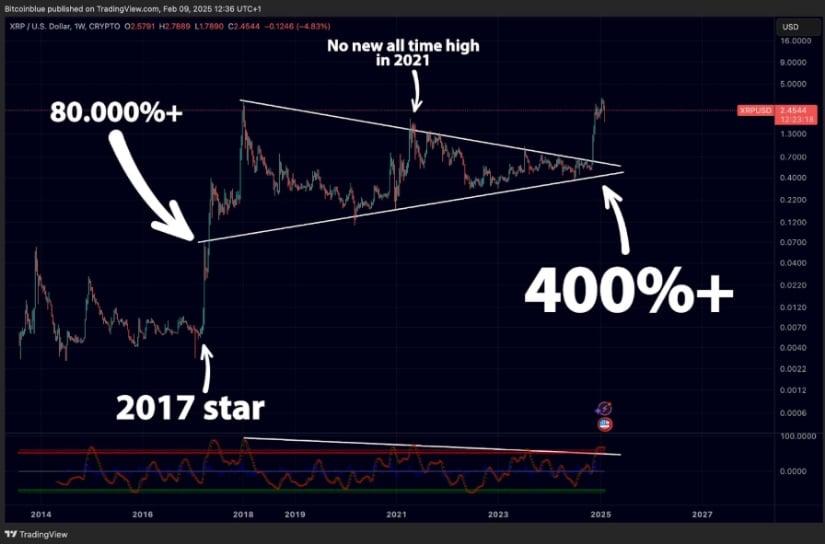
2017 Comparison
Another interesting observation: in 2017, one of the first altcoins to rally was XRP. In this bull market, history seems to rhyme, the first major breakout, with a 400% gain, once again came from XRP. Could Litecoin be the next token to follow in its footsteps?
Conclusion
With strong network activity, a long-term bullish technical structure, and even the moon phase lining up, Litecoin might be on the verge of a significant move. The 7-year triangle pattern suggests that if LTC breaks out convincingly, the measured technical target could reach around $700, a level not seen since the height of the 2017 bull run. While nothing in crypto is guaranteed, the combination of historical patterns, network growth, and technical setup makes Litecoin a chart worth watching closely.
