XLM Primed for Explosive Rally as Bullish Engulfing Pattern Emerges—Time to Buy?

Stellar (XLM) just flashed a classic bullish signal—and traders are scrambling for position.
The crypto’s chart painted a textbook Bullish Engulfing pattern this week, hinting at a potential breakout after months of sideways action. If history repeats, XLM could be gearing up for a run that leaves HODLers grinning (and short-sellers sweating).
Why This Pattern Matters
Bullish Engulfing candles signal a reversal when a larger green candle swallows the prior red one—basically the market shouting 'enough with the dip.' For XLM, it’s happening at a key support level, adding fuel to the breakout thesis.
The Road Ahead
Watch for volume spikes to confirm momentum. No guarantees in crypto-land—where ‘technical analysis’ sometimes means ‘educated guessing’—but the stars (pun intended) seem aligned. Just remember: in a market where ‘fundamentals’ can mean a billionaire’s tweet, even pretty charts need a reality check.

Despite limited mainstream hype, increased real-world use is bolstering the asset fundamentals, especially as platforms like MoneyGram and Circle’s USDC leverage the coin network for efficient cross-border payments and remittances.
Bullish Engulfing Pattern Signals Momentum Shift
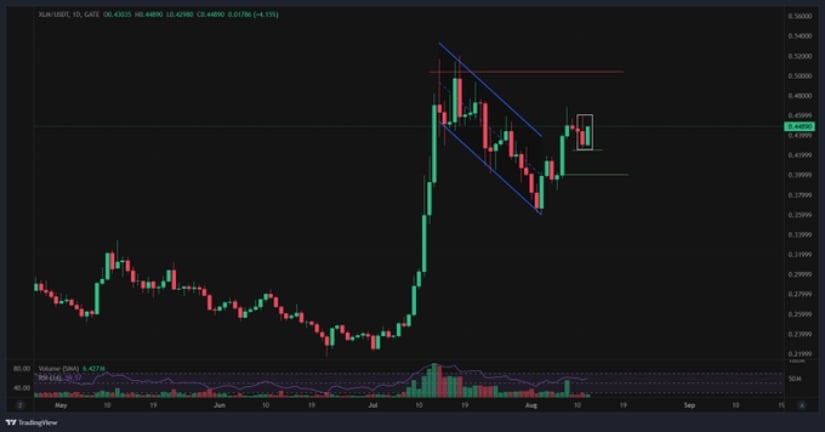
According to a recent observation by analyst Joe Swanson, the bullish engulfing candle pattern on the crypto chart reflects a shift towards buying pressure.
This pattern typically indicates that buyers have taken control, often leading to further price increases. The formation NEAR $0.44 support reinforces this outlook, providing a foundation for a potential rally.
Source: X
This consolidation period has kept the XLM price confined within a range, but a decisive break above the resistance near $0.46 could trigger a more sustained upward move. The bullish candle suggests that buyers are reentering the market, possibly setting the stage for the next leg up in price.
Stable Market Activity and Growing Institutional Adoption
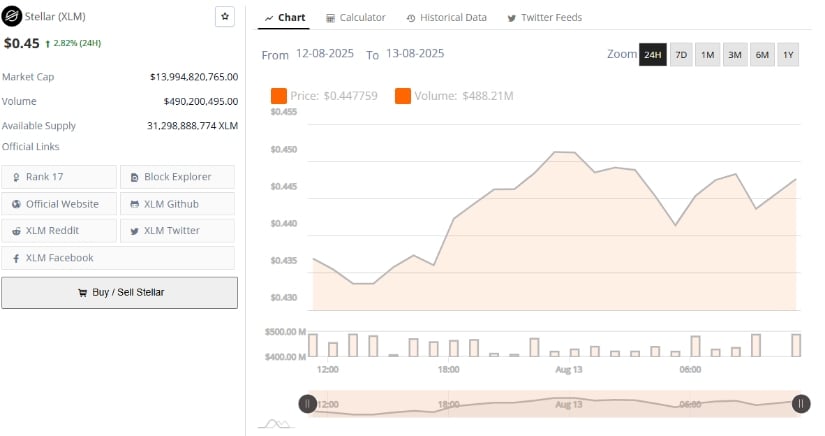
Additionally, BraveNewCoin data shows that the asset is trading at $0.45, marking a +2.82% gain over the last 24 hours. The price chart from August 12 to August 13, 2025, illustrates a generally upward movement after an initial dip to around $0.43.
Momentum built steadily through the day, peaking near $0.45 before a slight pullback and subsequent stabilization just below that level. The average price during this period sits around $0.4478, indicating steady buying pressure. The trend suggests that bulls have maintained control, gradually pushing the asset higher without extreme volatility.
Source: BraveNewCoin
From a market metrics perspective, the crypto holds a market capitalization of approximately $13.99 billion, ranking 17th among cryptocurrencies, which positions it as a major player with significant investor interest. The available supply is 31.3 billion of the asset, the 24-hour trading volume is about $490 million, representing strong liquidity.
This high turnover, nearly 3.5% of the total market cap, implies active participation from both retail and institutional traders. Volume data shows that while trading activity remained steady throughout the period, slight spikes aligned with upward price moves, reinforcing the view that buying demand fueled the rally.
Technical Indicators Show Mixed Signals but Trend Nearing Breakout
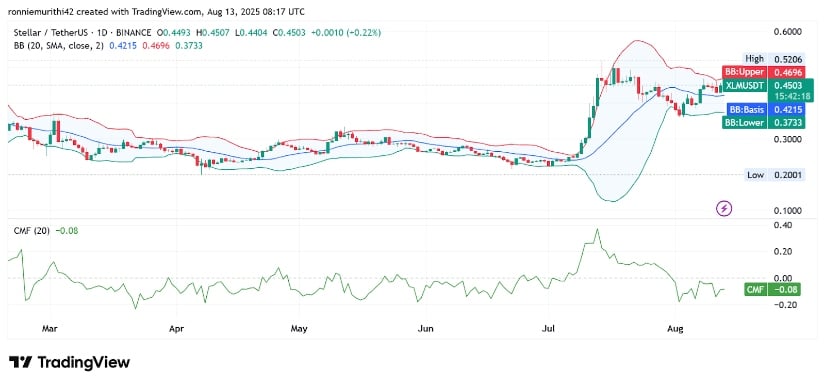
At the time of writing, XLM is trading at about $0.4494, just below the upper Bollinger Band. The price is consolidating within a symmetrical triangle pattern, which often precedes a volatility expansion and breakout. The compression of Bollinger Bands highlights this potential, signaling that price volatility may soon increase.
However, the Chaikin Money FLOW (CMF) is currently negative, indicating that selling pressure still slightly outweighs buying in the short term, which could delay an immediate strong upward move.
Source: TradingView
Despite this, recent upward price pushes indicate building bullish momentum. A close above the upper Bollinger Band and the $0.46 resistance zone WOULD further strengthen breakout prospects toward the next major resistance around $0.4687. Conversely, if support near $0.44 fails, the price could retrace to $0.4212.
Overall, the current technical setup combined with institutional use cases suggests that the coin is positioned at a critical juncture, where a bullish breakout is possible if key resistance levels are surpassed.
