SEI Price Prediction: SEI Shatters Resistance, Targets All-Time Highs in 2025 Rally

SEI isn't asking for permission—it's taking market dominance by force. The token just bulldozed through a critical resistance level, setting the stage for a potential price explosion.
Breaking the ceiling
Traders are scrambling as SEI's chart paints the prettiest breakout pattern since Bitcoin's last halving. No fancy indicators needed here—just pure price momentum carving through resistance like a hot knife through butter.
Next stop: Price discovery
The charts whisper what the bulls already know: SEI's flirting with territory that could make early backers very rich. Meanwhile, Wall Street 'experts' still can't decide if crypto is a scam or the future—classic hedge fund paralysis.
One thing's certain: SEI's writing its own rules now. Whether you're along for the ride or watching from the sidelines, this train isn't stopping for doubters.

The breakout follows a consolidation period between $0.15 and $0.30, forming an ascending triangle pattern—a key technical indicator of strength. Maintaining support in the $0.30–$0.35 range will be critical to sustaining this momentum and targeting new highs.
SEI Breakout Above Resistance Level Signals Bullish Momentum
An X analyst, @follis_, highlighted the clear breakout above $0.30, confirming strong buying interest after the consolidation phase. The chart shows the formation of an ascending triangle—a pattern typically associated with continuation and bullish sentiment.
Technical indicators such as the Relative Strength Index (RSI) and the Moving Average Convergence Divergence (MACD) signal robust bullish momentum, aligning with the price surge.

Source: X
However, the RSI approaching overbought territory implies that caution is warranted, as the asset may experience a price correction or temporary consolidation if buying momentum slows.
The analyst suggests watching the $0.30 support level carefully; if this zone holds firm, $SEI could push towards the next resistance around $0.40 or higher. Retracements to the support level may serve as buying opportunities in this context.
Market Activity Reflects Active Trading and Volatility
According to Brave New Coin, SEI’s 24-hour chart shows the price fluctuating roughly between $0.295 and $0.315 but settling NEAR $0.2997, a decline of 5.59% over the period.
This decline appears to be part of short-term profit-taking or broader market weakness rather than a panic sell-off, supported by relatively stable trading volumes around $189 million (over 10% of market cap).
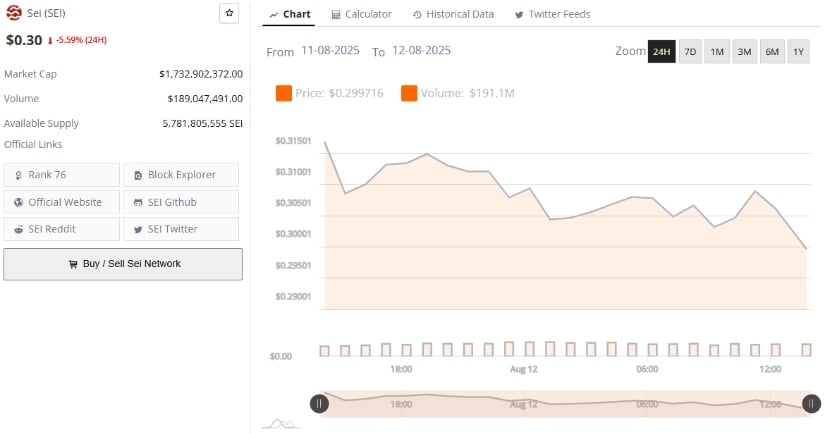
Source: BraveNewCoin
The market cap stands near $1.73 billion, ranking SEI 76th among cryptocurrencies by capitalization, indicating mid-to-upper tier status with liquidity and institutional interest balanced against some inherent volatility.
Volume patterns mirror price movements and show consistent trading activity, suggesting slight selling pressure outweighing buyers. If this trend persists, Sei may test lower support levels but could stabilize near the $0.31 range if buying activity strengthens.
Technical Indicators Highlight Crucial Support and Trend Strength
At the time of writing, the TradingView chart reveals SEI trading close to $0.2995 with a recent decline of approximately 1.84%. The Chaikin Money FLOW (CMF) indicator shows a slight bearish bias at -0.03, indicating that selling pressure remains but is not overwhelming, suggesting the potential for a weakening downtrend and possible rebound.
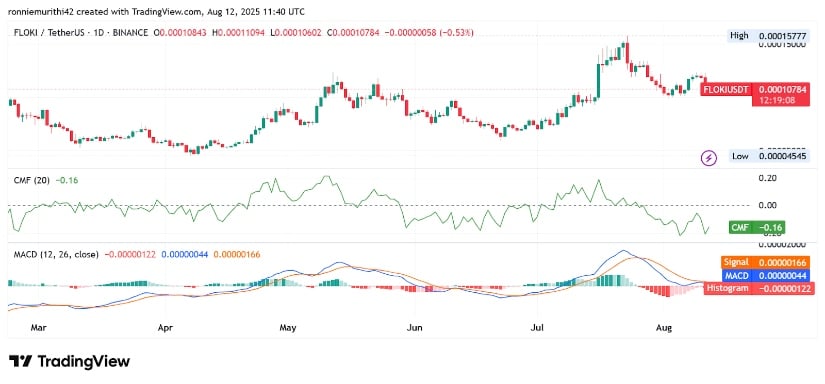
Source: TradingView
The MACD shows a minor bearish crossover, hinting at short-term weakness. Still, the consolidation around key levels hints at a potential base forming between $0.25 and $0.30. If SEI can stabilize and break decisively above $0.30, bullish momentum may accelerate, increasing the likelihood of testing higher resistance such as $0.35.
Volume was relatively low during the price decline, indicating reduced conviction among sellers. This supports the scenario where the next few sessions will be crucial in determining the near-term direction. Holding above $0.30 is essential for maintaining the breakout’s validity and continuing the upward trend.
