Uniswap’s UNI Targets $14 Breakout as Bullish Momentum Defies Gravity—Traders Brace for Next Leg Up

DeFi's favorite liquidity workhorse just won't quit. Uniswap's UNI token is carving a path toward $14 as buyers dig trenches around key support levels—proving once again that crypto markets laugh at 'overbought' RSI readings.
Anatomy of a rally:
The governance token flipped resistance into a springboard, with whale wallets accumulating on dips. Chartists eye the $14 horizon as shorts get squeezed harder than a leveraged farmer during a MEV attack.
Why this isn't just another shitcoin pump:
Unlike projects that peak during a Coinbase listing, UNI's volume surge coincides with actual protocol usage—though let's be real, half those transactions are probably arbitrage bots fighting over sandwich attacks.
The move comes as Ethereum's L2 ecosystem bleeds value back into blue-chip DeFi tokens—because nothing says 'safe haven' like volatile governance tokens from unregulated protocols. Watch those support levels like a hawk; crypto doesn't do 'soft landings.'

Trading activity has increased significantly, with price movements indicating strong buying interest as the coin approaches crucial supply zones. This momentum reflects an ongoing effort among market participants to defend important supports while aiming for higher targets.
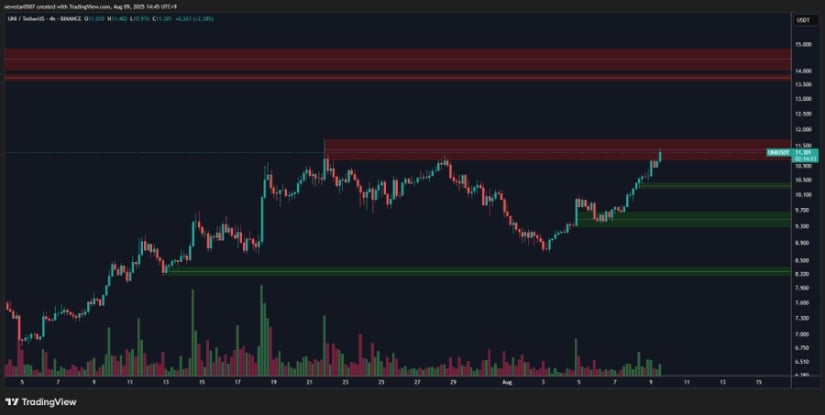
Uniswap Price Resistance and Support Zones
In CW’s recent post, the hourly UNI/USDT chart illustrated a clear upward trend after prices hit a bottom in early August. The price has successfully broken through several resistance points, approaching a critical supply zone just above $11, spanning roughly $11.20 to $11.60.
This area represents a major obstacle where many sellers might step in to take profits.
Source: X
The analyst pointed out that surpassing this zone WOULD be a strong bullish signal, potentially opening the path toward the larger resistance or “sell wall” between $13.80 and $14.80.
Below the current trading price, CW highlighted crucial support areas NEAR $9.50 to $9.80 and another between $8.20 and $8.40.
These zones, which previously acted as resistance, have now flipped to support levels—indicative of a healthy trend reversal where buyers defend key price floors. These support levels provide a solid foundation, helping to sustain the ongoing rally as UNI inches closer to the $14 resistance.
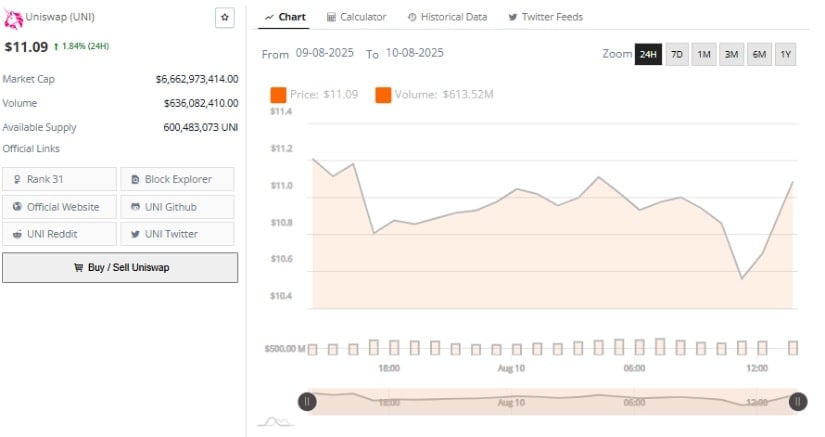
Strong Volume Confirms Active Market Participation
Supporting the analyst’s observations, recent 24-hour data from BraveNewCoin shows Uniswap’s trading volume at a substantial $636 million. This elevated volume underscores that the market is actively engaged, with buyers reacting strongly to price dips and sellers challenging gains within critical zones.
Source: BraveNewCoin
A notable price drop this morning to about $10.50 was swiftly met with aggressive buying, driving prices back up to around $11.09. This V-shaped recovery pattern demonstrates robust demand and highlights that buyers are committed to defending these key price levels.
The volume spikes accompanying this rebound confirm that recent price movements are backed by genuine market interest rather than isolated trades or thin liquidity. This active engagement suggests that both bulls and bears are closely contesting current price points in anticipation of further developments.
Technical Indicators Point to Consolidation
On the other hand, examining the daily chart, the price recently retreated from near the upper Bollinger Band and is now consolidating close to the mid-Bollinger Band around $10.11, which serves as a potential support level. This positioning reflects a short-term retracement following the recent rally, characteristic of periods of market cooling after strong gains.
The Relative Strength Index (RSI) is positioned at 58.80, comfortably above the neutral midpoint but below overbought thresholds, indicating sustained bullish momentum without excess. Furthermore, the RSI line remains above its moving average, a signal that underlying positive sentiment has not waned entirely despite recent price pullbacks.
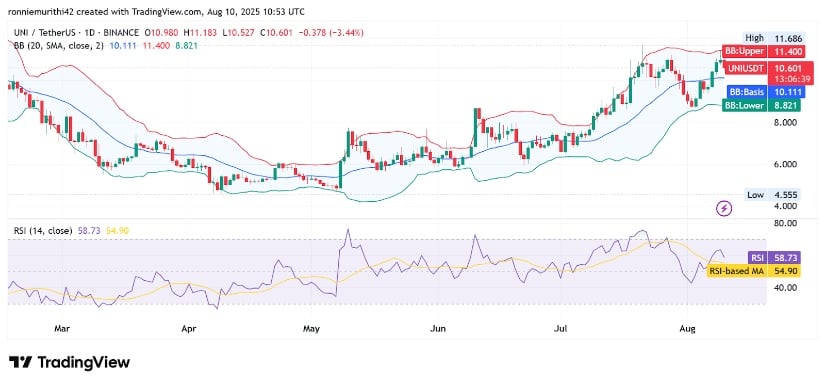
Source: TradingView
This combination of maintained support levels, elevated volume, and favorable momentum metrics suggests that UNI is navigating a phase of consolidation with bullish undertones. Market participants will be closely monitoring price action to determine whether the mid-Bollinger Band can hold as support, potentially enabling the asset to resume its upward movement. Conversely, a breach below this level might signal a deeper correction.
Overall, the presence of strong buying interest and well-established support zones indicates that UNI remains well-positioned for improved price performance in the near term as it eyes the $14 resistance area.
