HBAR Shatters Fibonacci Resistance—Here’s Why Bulls Are Taking Over

HBAR just ripped through a key Fibonacci level—and traders are betting this breakout has legs. Here’s what’s fueling the surge.
### The Fibonacci Breakout: More Than Just Lines on a Chart
When HBAR breached that resistance, it wasn’t just technical traders cheering. The move signals a potential shift in market structure—something even the skeptics can’t ignore (though they’ll still mutter about ‘voodoo math’).
### Bullish Momentum Builds
No pullback, no hesitation. HBAR’s price action is behaving like an asset with institutional FOMO—rare in a market where most ‘breakouts’ fizzle faster than a crypto influencer’s credibility.
### The Cynic’s Corner
Sure, Fibonacci levels work… until they don’t. But for now? Even the suits are quietly recalculating their targets—between sips of their $8 artisanal pour-over, naturally.

The recent price action indicates a shift in market sentiment, with HBAR holding above key support levels and breaking through resistance zones.
Technical indicators, including the double bottom pattern and flipped Fibonacci level, reinforce the bullish outlook. Despite a mild dip in the past 24 hours, the overall market structure remains constructive, suggesting that it may continue its upward trajectory. Analysts are closely monitoring price movements, anticipating a breakout above $0.27 or further support at $0.26.
HBAR Price Breaks Through Resistance, Bullish Trend Expected
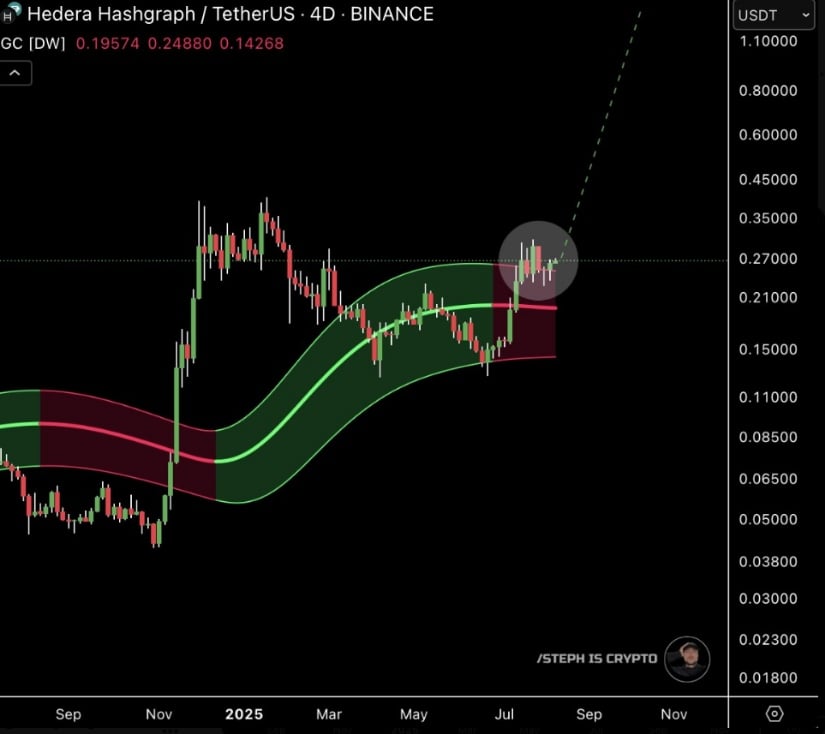
The chart shared by Steph is Crypto, indicates that Hedera has successfully reclaimed the Gaussian channel, a technical tool used to identify market trends and volatility. This recovery within the channel suggests that the token is poised for an upward move.
Source:X
The Gaussian channel’s significance lies in its ability to capture price volatility and market behavior. The coin’s recent success in this area supports the argument for a continued bullish trend, as it is moving above the necessary support zones.
With the memecoin showing signs of strength, analysts are observing its ability to break through resistance points and maintain upward momentum. The overall outlook remains positive, as the digital asset appears set for a potential rally.
Double Bottom Pattern Signals Possible Reversal
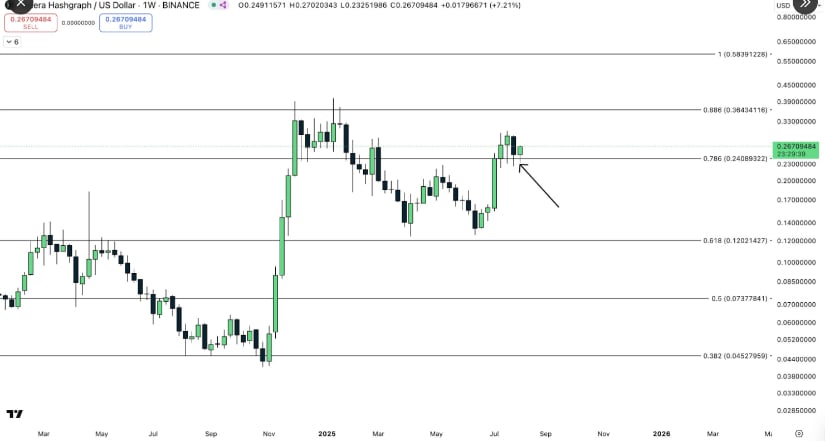
According to analyst Chad, the formation of a double bottom on the token’s weekly chart is an important technical indicator. The double bottom pattern often signals a market reversal, and in its case, this suggests that the price has hit a key support level. The price action suggests that the digital asset is in a favorable position to continue its upward movement.
Source:X
The coin’s price has also managed to flip the 0.786 log Fibonacci level from resistance to support, which strengthens the bullish outlook. Fibonacci retracement levels are crucial in technical analysis as they provide insight into where prices may retrace or extend during trending markets.
The fact that it has reclaimed this level reinforces expectations of continued gains. As the asset forms higher highs and higher lows, the market appears to be in a strong phase of growth.
Volume Patterns Reflect Market Participation
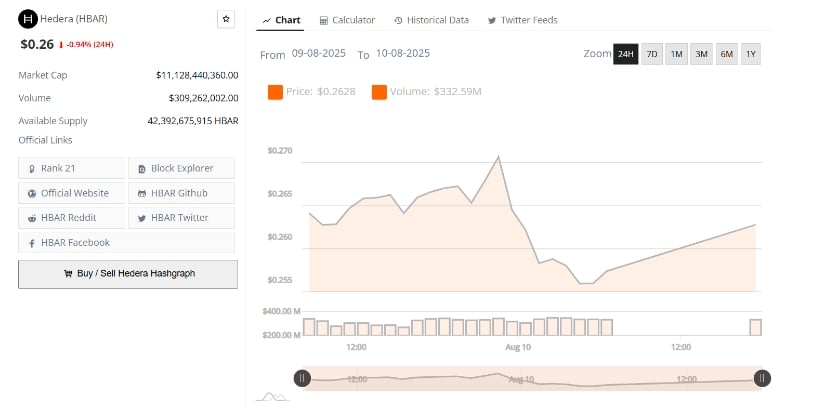
Over the past 24 hours, Hedera has experienced minor fluctuations, with a dip of 0.94%, bringing its price to $0.26. Despite this, the trading volume has remained relatively high, suggesting consistent market interest. A surge in trading volume was particularly noticeable in the early morning hours of August 10, 2025, indicating that increased market participation may have played a role in the recent price movements.
Source: BraveNewCoin
The trading volume is often a key indicator of market sentiment, as it reflects investor activity and interest in a particular asset.. For the crypto, the increase in volume could suggest that traders are preparing for a potential price breakout above $0.27. However, if the volume decreases or the price consolidates below $0.26, further corrections may occur in the short term.
Resistance Levels and Key Support Zones
The coin is currently trading between the price levels of $0.26 and $0.27, which indicates a period of stability and consolidation after recent volatility. With the asset holding these levels, market participants are watching closely for a breakout above the $0.27 resistance or a firm support test at $0.26.
The digital asset’s price is gradually building momentum, with traders anticipating a possible rally if it can break above the $0.27 resistance. Should it maintain its position and volume increases, it could continue testing higher resistance levels, confirming the bullish trend.
