XLM Shatters Bullish Flag—70% Price Surge Imminent as Rally Gains Steam

Stellar's XLM just ripped through a textbook bullish flag pattern—and the charts are screaming buy. Here's why traders are flipping long.
The breakout playbook
Flag patterns don't get much cleaner than this. After weeks of consolidation, XLM's decisive breakout suggests the altcoin's primed to retest previous highs. Technicals point to one thing: momentum traders are about to feast.
The 70% gambit
That's not hopium—it's simple math. Measured move projections from the flag's pole suggest a potential 70% upside if buying pressure holds. Of course, in crypto, 'if' is doing some heavy lifting here.
Cue the institutional déjà vu
Watch for the usual suspects: leveraged longs piling in, exchange reserves thinning, and at least three 'this time it's different' hot takes from crypto influencers. Because nothing says 'healthy market' like a good old-fashioned FOMO chase.
XLM's move could spark fresh capital rotation into mid-caps—or become another case study in why TA works until it doesn't. Either way, buckle up.
Trading at $0.46, the coin has risen 14.61% in the last 24 hours, with analysts projecting gains of up to 70% shortly. This surge follows a period of consolidation, positioning the asset for a significant MOVE ahead.
XLM Crypto Bullish Flag Breakout and Momentum Build-Up
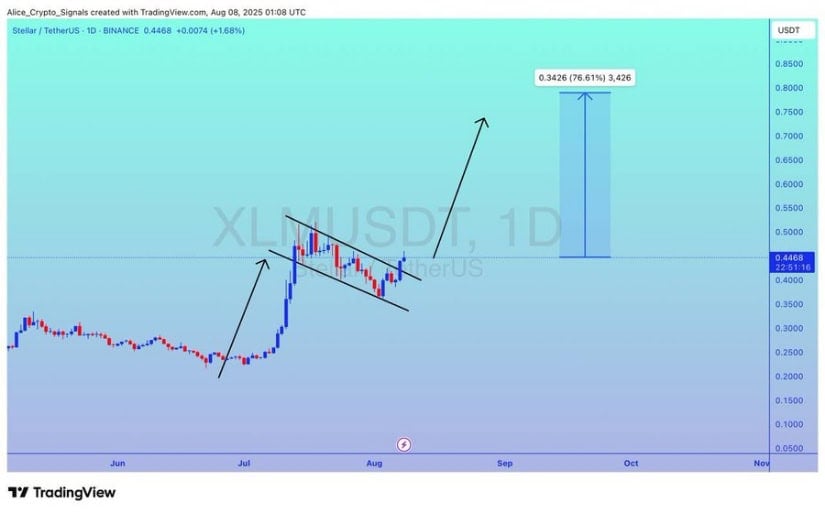
In a recent update, analyst Alice crypto highlighted a key breakout from a bullish flag pattern on the crypto chart. The formation, which indicates consolidation before a breakout, saw the coin surpass the upper boundary, confirming the next upward phase. The breakout sets the stage for a potential rally, targeting the $0.80 level, marking a potential increase of over 70%.
Source: X
The chart reveals a consolidation phase that followed a sharp rally in July. Such patterns often signal the buildup before a strong upward move. The coin has maintained its position above the breakout point, strengthening the bullish outlook and suggesting the possibility of further gains. With the current price holding steady, market participants are watching for the next leg in this upward movement.
Market Activity and Volume Surge
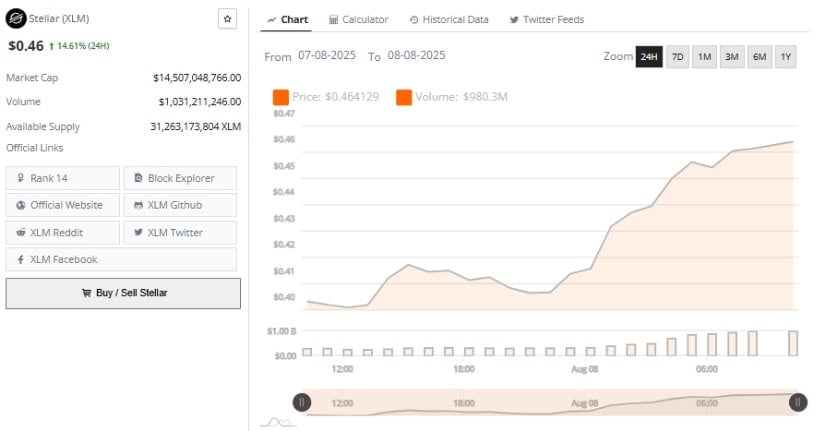
At the time of writing, data from BraveNewCoin shows the crypto trading at $0.46, marking a 14.61% increase within the past 24 hours. Trading volume has surpassed $1 billion, indicating heightened interest and significant inflows into the asset. This surge in participation underscores strong demand and suggests that the coin is on track for further growth in the short term.
Source: BraveNewCoin
XLM price action continues to show steady upward momentum, with consistent buying pressure. This strength in price movement is a positive indicator, as increased market participation reflects a shift in sentiment toward more aggressive accumulation.
The ability of the coin to hold NEAR its recent highs signals continued confidence in its potential for further price appreciation.
As the price continues to climb, traders will be keeping an eye on whether the buying volume remains high. A sustained increase in volume WOULD validate the current bullish trend. However, a drop in volume could signal a short-term consolidation before the next major move higher.
Bollinger Bands and RSI Indicators
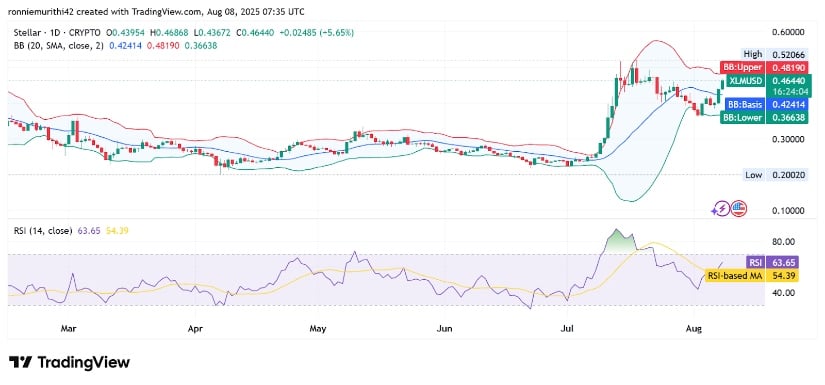
According to data from TradingView, XLM crypto is pushing toward the upper Bollinger Band at $0.4816, signaling growing bullish pressure. Bollinger Bands are used to track price volatility, and breaking through the upper band with high volume would suggest the coin could move toward higher price levels. The upper band typically serves as a resistance zone, and a successful break could signal continued upward momentum.
Source: TradingView
In addition, the Relative Strength Index (RSI) stands at 63.45, indicating that the coin is nearing but not yet in overbought territory. The RSI suggests there is still room for additional upward movement, with the crypto not yet reaching exhaustion. The moving average based on the RSI also supports the positive trend, further confirming the strength of the current market.
Should XLM price break above the upper Bollinger Band and maintain strong volume, the next target for the coin could be around the $0.52 resistance level. However, traders should be mindful of overbought conditions, as a pullback could follow if the rally becomes too extended without sufficient buying support.
