Hedera (HBAR) Primed for Explosive Breakout: Can It Shatter All-Time Highs in 2025?

HBAR bulls are charging—again. The enterprise-grade blockchain token flirts with a decisive breakout as institutional interest surges and network adoption hits escape velocity.
Why this rally isn’t just DeFi degens chasing pumps
Forget memecoins. Hedera’s hashgraph consensus (sorry, Bitcoin maxis) delivers sub-second finality with carbon-negative ops—a combo that’s snagged partnerships from Boeing to the Fed. Now, with staking yields outperforming Treasury bonds, even Wall Street’s spreadsheet jockeys are paying attention.
The technical setup screams opportunity
Ascending triangle on the weekly chart? Check. RSI cooling off from overbought territory just as volume spikes? Double check. If HBAR clears $0.45 resistance, the path to $1 opens up—and yes, that would mean new ATHs.
Of course, crypto never moves in a straight line. Watch for fakeouts if macro headwinds hit—because nothing makes traders panic-sell faster than Jerome Powell clearing his throat. But with real-world utility finally catching up to the hype (unlike certain *cough* monkey JPEG projects), HBAR’s 2025 breakout story might just write itself.

As the market prepares for a potential breakout, technical indicators and expert analysis suggest that HBAR could be gearing up for a surge, possibly reaching new highs by the end of 2025. Traders are keenly watching its movements, especially after several breakout signals and positive momentum in the market.
Hedera’s Weekly Chart Shows Strong Bullish Momentum
The weekly chart shared by analyst WSB Trader Rocko provides a detailed view of Hedera’s progress. According to Rocko, HBAR has demonstrated strong bullish momentum since breaking above the $0.20 resistance level.
This breakout has been followed by a surge to a high of $0.27, highlighting significant buying interest. Rocko emphasizes that if HBAR price holds above the $0.240 support level, the token may continue its upward trajectory, potentially reaching the $0.30 level shortly.
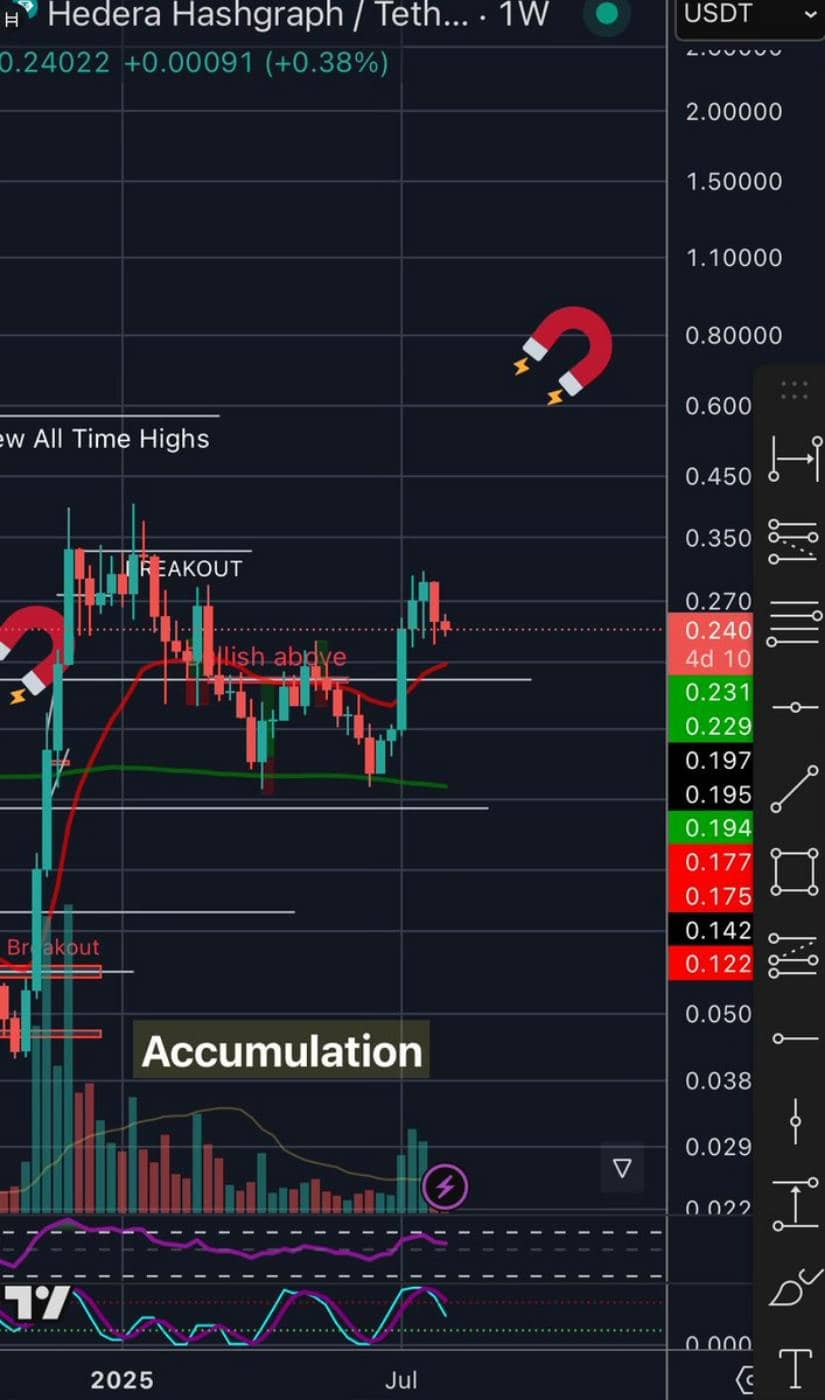
Source: X
Rocko’s analysis also suggests that Hedera is in the process of building a solid base for further growth, having gone through an accumulation phase earlier this year. If the price continues to consolidate above the $0.240 mark, a move towards new all-time highs is not out of the question.
The analyst’s outlook for the end of 2025 remains positive, indicating that HBAR may continue to rise as long as it maintains key support levels and sustains bullish sentiment across broader market conditions.
Consolidation and Bullish Potential on the 24-Hour Chart
On the other hand, the 24-hour chart from BraveNewCoin shows HBAR trading at approximately $0.25, with the price consolidating between $0.240 and $0.250.
This range-bound movement typically signals an accumulation phase where market participants are positioning themselves for a potential breakout. Volume data suggests moderate trading activity, with a peak in volume seen earlier in the day on August 7, 2025, followed by a gradual decline.
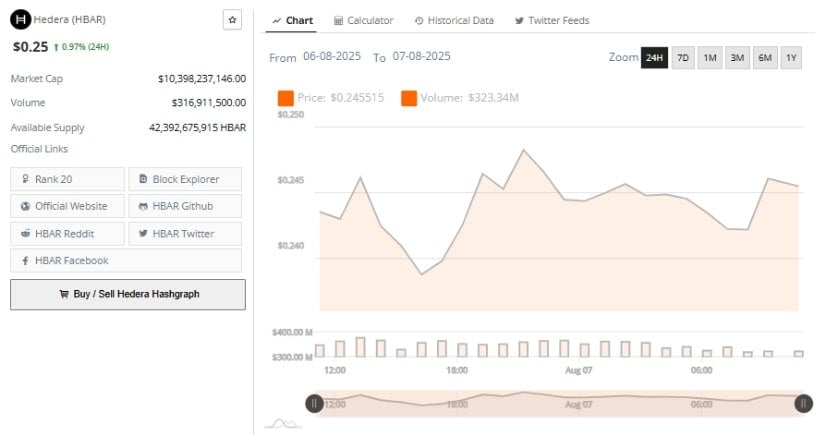
Source: BraveNewCoin
Testing the $0.24 support level is crucial for the current price action. If HBAR price manages to maintain above this support, it could indicate the strength of this bullish phase, allowing the price to MOVE towards the $0.30 resistance.
However, a drop below the $0.24 mark could prompt a bearish reversal, signaling further downside risks. Investors and traders are watching these levels closely to determine the next move in Hedera’s price action.
Positive Momentum Indicated on TradingView’s Daily Chart
At the time of writing, the daily chart from TradingView shows a positive trend for Hedera, with the price hovering around $0.245. The Moving Average Convergence Divergence (MACD) indicates a bullish momentum, with the Percentage Price Oscillator (PPO) reading at 3.10, reinforcing the upward trend.
Additionally, the Relative Strength Index (RSI) stands at 52.07, showing a balanced market sentiment, neither overbought nor oversold, which leaves room for further price movement.
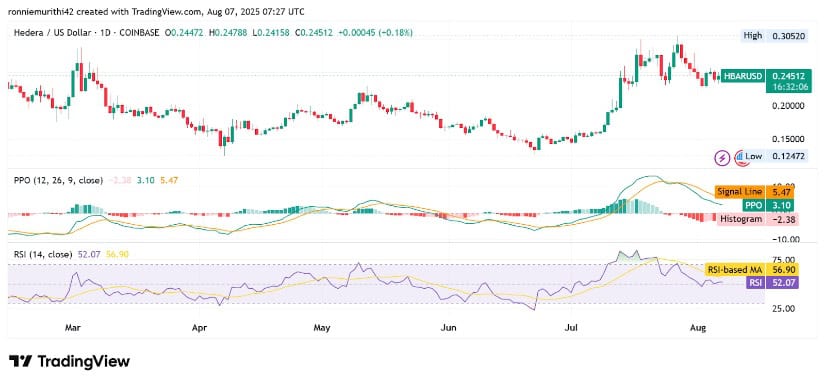
Source: TradingView
The current price action on the TradingView chart suggests consolidation, which could lead to a breakout if the $0.25 resistance level is breached. If HBAR manages to hold above this level, it may see continued upside momentum towards the $0.30 level.
The neutral RSI further supports the possibility of additional growth, indicating that there is still room for bullish continuation without entering overbought territory.
As Hedera continues to consolidate, key support and resistance levels will be critical in determining its next move. Should Hedera break above $0.25 and hold these gains, the potential for significant growth remains strong, with analysts predicting further bullish momentum into the latter part of 2025.
