🚀 Uniswap Primed for Explosive Breakout: Bullish Flag Signals $10.84 Target

Uniswap's chart is painting a textbook bullish flag—and traders are loading up for the next leg up.
The Setup:
After consolidating below resistance, UNI's tightening price action mirrors historical breakout patterns that typically precede 20-30% rallies. The $10.84 target isn't just hopium—it's where the math says liquidity pools are waiting to get raided.
Why It Matters:
While traditional markets obsess over Fed whispers, DeFi's workhorse DEX keeps printing opportunities. (Take notes, Wall Street—this is what real price discovery looks like.)
The Catch:
Flags can snap bearish if Bitcoin decides to throw a tantrum. But with UNI's volume quietly building? Bet against this breakout at your own peril.

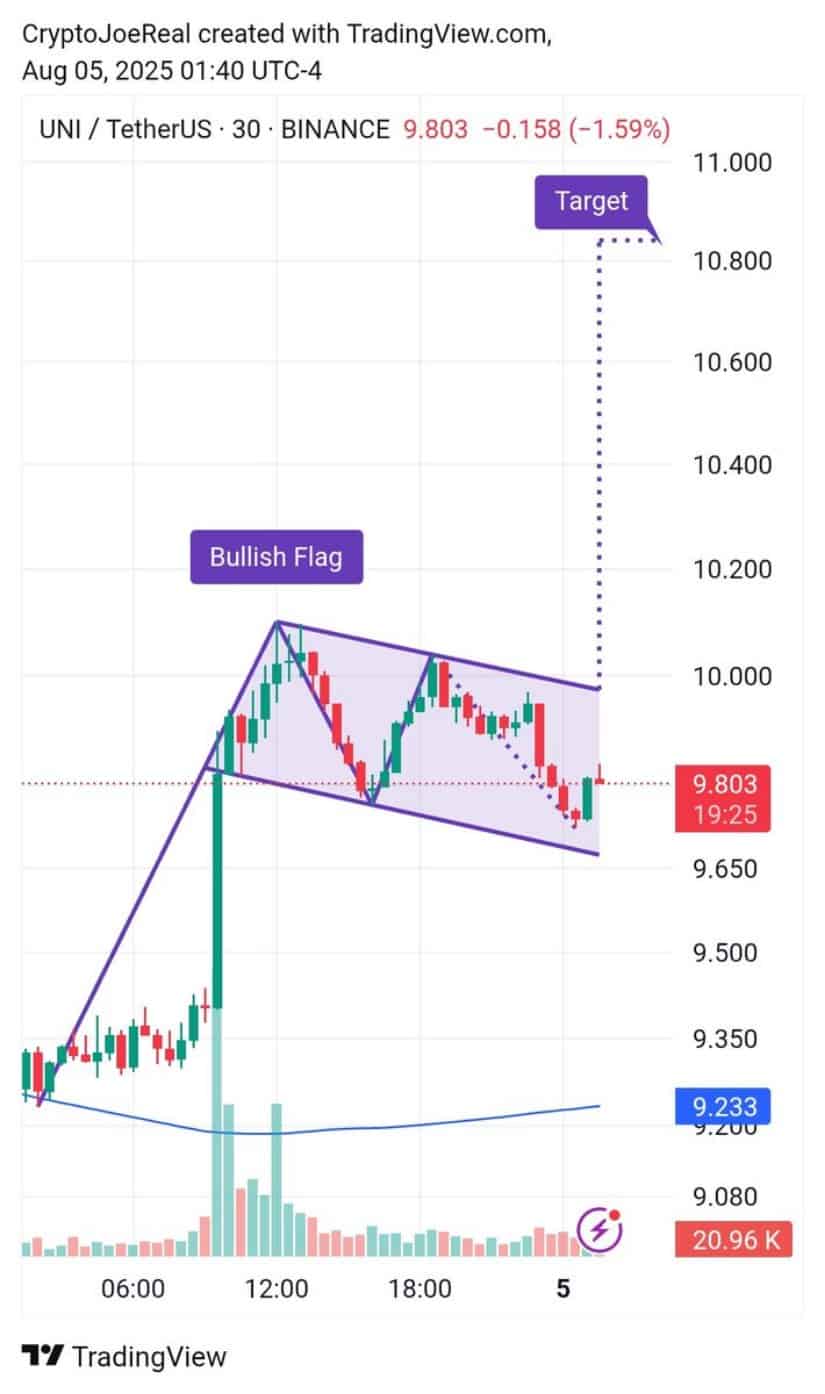
The consolidation phase following a sharp upward movement has set up a key breakout point, and analysts are targeting a price of $10.84.
With strong technical signals and increasing volume, the market is primed for a MOVE higher, but traders are awaiting confirmation of a break above the resistance line.
Bullish Flag Pattern Points to Upside Potential
The formation of the Bullish Flag on Uniswap’s 30-minute chart suggests that the price is preparing for a continuation of its previous rally. The pattern is characterized by a sharp price increase followed by a downward drift, forming a rectangular consolidation range.
This consolidation is contained by two parallel trendlines, and a breakout above the upper trendline is expected to push the price higher. The target for this breakout is estimated at $10.84, which aligns with a natural extension of the pattern.
Source: X
Volume data accompanying this pattern shows that it has been gradually decreasing during the consolidation phase, which is typical of a flag pattern. This decline in volume during the price pullback indicates that there is no significant selling pressure at these levels.
As the price tightens within the flag, it suggests that buying interest is gradually increasing. A breakout accompanied by a surge in volume WOULD further confirm the bullish outlook, potentially sending UNI toward its target at $10.84.
Volume Activity and Resistance at $9.80
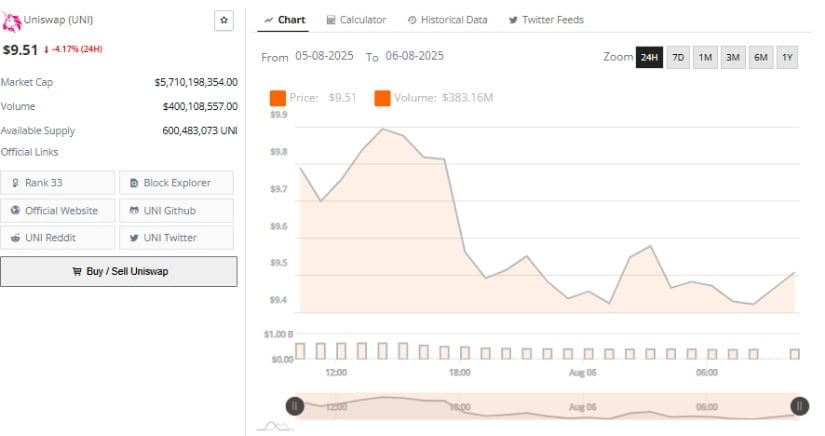
Despite the bullish flag pattern, the 24-hour chart for Uniswap reveals a more cautious price action in the short term. Over the past 24 hours, UNI dropped 4.17%, retreating from $9.91 to $9.51 before recovering slightly to $9.64.
This price action suggests that the token is consolidating below the $9.80–$10.00 resistance zone. While the price has shown resilience at these levels, it has failed to break above the resistance, indicating that the market remains hesitant.
Source: BraveNewCoin
Volume data during the recent session confirmed strong market activity, with over $383.16 million traded. However, the volume distribution shows that buyers were actively involved in the initial price rallies but were followed by profit-taking during retracements.
This suggests a temporary lack of momentum to push UNI through its short-term resistance. The price will need to establish a firm base above $9.80, supported by stronger volume, before any significant breakout can be confirmed.
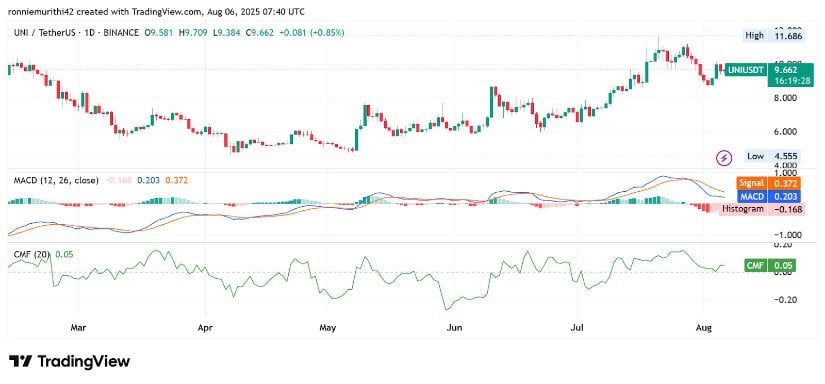
Technical Indicators Reflect Mixed Sentiment
The technical indicators on the daily chart for Uniswap paint a mixed picture, with momentum showing both bullish and bearish signs. The MACD currently sits at 0.202, slightly below the signal line of 0.371, while the histogram stands at -0.170.
This configuration suggests a weakening bearish momentum but no definitive bullish crossover yet. Traders will be watching for a potential convergence of the MACD lines, which could signal a shift in momentum favoring the bulls.
Source: TradingView
Meanwhile, the Chaikin Money FLOW (CMF) presents a more optimistic outlook, with a positive reading of 0.05. This indicates that capital inflows are gradually outweighing outflows, suggesting some underlying buying pressure.
If the CMF continues to rise and the price stabilizes or moves higher, it could support a more sustained bullish trend. However, the market remains in a consolidation phase, and any further movement depends on a confirmation of the breakout pattern. A clean break above $9.80 could trigger the next leg toward the $10.84 target.
Overall, while technical indicators are mixed, the formation of the bullish flag pattern combined with underlying support at key levels suggests that Uniswap is poised for a breakout in the NEAR term.
