Optimism (OP) Primed for Breakout: $1.45 and $2.00 Targets in Sight as Accumulation Phase Ends

Layer 2 darling Optimism (OP) flashes bullish signals as its price action hints at an exit from accumulation—traders now eyeing $1.45 and $2.00 as next targets.
### The Setup: From Sideways to Skyward?
After weeks of grinding sideways—punctuated by the occasional fakeout to torment retail—OP’s chart finally shows conviction. The breakout pattern mirrors early-stage rallies that previously doubled its value. Cue the ‘this time it’s different’ chorus.
### Targets: Two-Stage Rocket
First stop: $1.45, a level that’s more psychological than technical. Clear that, and $2.00 becomes the FOMO magnet—especially with crypto Twitter’s permabulls already drafting ‘I told you so’ threads. Just don’t mention the 37% retrace that usually follows.
### The Fine Print: Volatility Ahead
Yes, the trend’s your friend—until it isn’t. OP’s fundamentals (hello, airdrop farmers cashing out) could turn this breakout into a bull trap faster than a VC dumps their locked tokens. Trade accordingly—or better yet, pretend you will.

Market analysts have identified compression patterns and historical support zones that suggest a bullish bias may be emerging.
As technical signals begin to align, traders are watching for confirmation of a MOVE beyond current resistance levels. Price activity across multiple timeframes indicates a transition from markdown to a possible markup cycle.
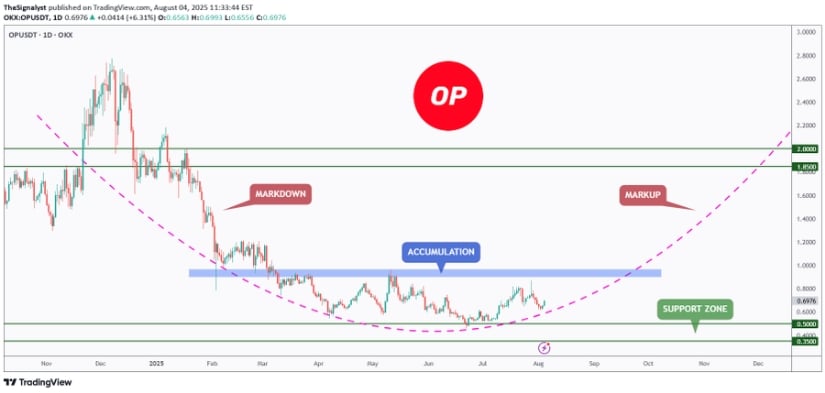
Wyckoff Accumulation Pattern Aligns With Long-Term Support
Technical analyst Barry (@ChartMonkeyBTC) shared a Wyckoff-style chart setup sourced from @TSignalyst, highlighting a multi-month accumulation zone forming above the $0.30–$0.40 support band.
This range has served as a base since the first quarter of 2025, following a prolonged markdown that pushed OP from highs NEAR $3.00. Repeated rejections at the lower trend boundary and consistently higher lows indicate that buyers have maintained control over this critical support structure.
Source: X
The parabolic curve overlay suggests a transition into a potential markup phase, provided the price holds above the accumulation zone. Previous breakout attempts near the $0.90–$1.00 range failed to gain momentum, forming a flat-top consolidation pattern.
A breakout above this horizontal barrier could unlock further gains, with technical projections outlining initial resistance around $1.45. A secondary target near $2.00 has also been mapped, reflecting previous highs recorded in late 2024. This transition remains contingent on a volume-supported breakout from the current range.
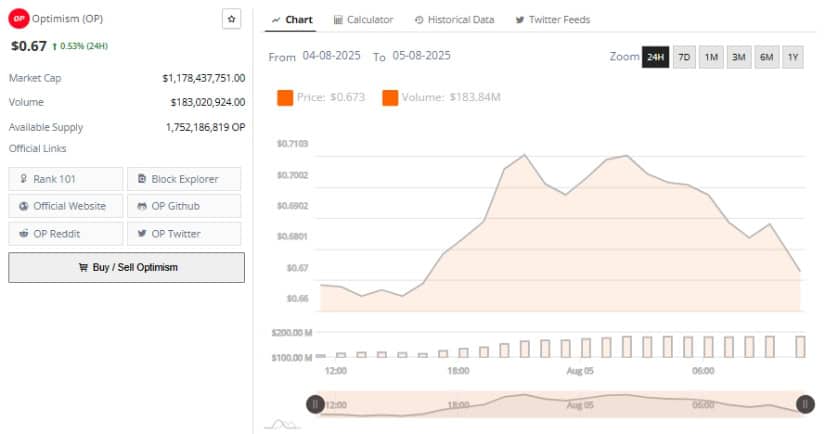
Volume Surge Meets Intraday Resistance Near $0.70
In the last 24 hours, OP traded within a narrow band, opening near $0.667 and reaching an intraday high of $0.703 before closing at $0.67. The price action suggests mild bullish intent but a failure to hold above psychological resistance around $0.70.
This level has now been tested multiple times, marking it as a significant short-term barrier. The modest 0.53% gain over the period reflects constrained momentum despite brief upward pressure.
Source: BraveNewCoin
Volume surged during the early stages of the price advance, with total trading volume reaching $183.84 million. This spike coincided with the rally from $0.667 to $0.703 but quickly faded as profit-taking set in.
The divergence between rising price and falling volume suggests that buying momentum may not be sufficient to sustain an immediate breakout. If buyers re-enter the market and push the token above $0.70 with conviction, short-term price action could begin aligning with the longer-term accumulation outlook.
Optimism’s market capitalization currently stands at approximately $1.178 billion, placing it 101st among digital assets. Its circulating supply of over 1.75 billion tokens contributes to the asset’s responsiveness to volume surges and short-term sentiment shifts. A decisive move above the current range would likely require broader market support or catalyst-driven demand from DeFi-related news or ethereum layer-2 activity.
Technical Indicators Show Mixed Momentum Across Daily Chart
At the time of writing, Optimism is trading at $0.672, reflecting a 4.55% decline from its previous session high of $0.706.
The price has fallen below immediate support near $0.68, which may now act as resistance if downward pressure persists. A failure to reclaim this level may expose OP to further tests of $0.64 and $0.61, both zones of previous consolidation.

Source: TradingView
Momentum indicators lean bearish. The MACD line has dropped below the signal line, with a histogram reading of -0.011 suggesting a weakening trend. RSI is currently at 48.37, below the moving average value of 51.92, indicating reduced strength among buyers.
The RSI’s downward slope from mid-July suggests continued caution until a reversal or bullish divergence appears. Price must reestablish stability above $0.70 and regain volume support to support the breakout targets outlined in the Wyckoff accumulation framework.
