Optimism (OP) Primed for $0.72 Breakout as Trading Volume & Bullish Momentum Surge

Optimism's native token OP is flashing bullish signals as traders pile in—could this be the run to $0.72?
Volume spikes and technical momentum suggest OP is gearing up for a major move. Here's why traders are betting big.
The Setup:
OP's recent consolidation looks like a coiled spring, with trading volume surging 47% in the past 24 hours. The $0.72 resistance level is now in play—a break could trigger algorithmic buying waves.
Why It Matters:
Layer 2 narratives are heating up again, and Optimism's tech stack keeps attracting defi degens despite the 'modular blockchain' buzzword fatigue. (Yes, we’ve heard about your 'novel execution layer'—just make it fast and cheap.)
The Bottom Line:
Watch the $0.72 level like a hawk. If OP holds above this zone, we might see a classic liquidity grab toward higher targets. Or, in crypto terms—another 'totally predictable' 30% pump that retail notices three days late.

The token saw a moderate rebound from local lows, supported by steady volume and higher intraday lows.
While price remains below key resistance, traders are closely monitoring structure shifts for confirmation of a potential upside move. At the time of writing, indicators suggest neutral momentum, with OP positioned just below the critical $0.70 threshold.
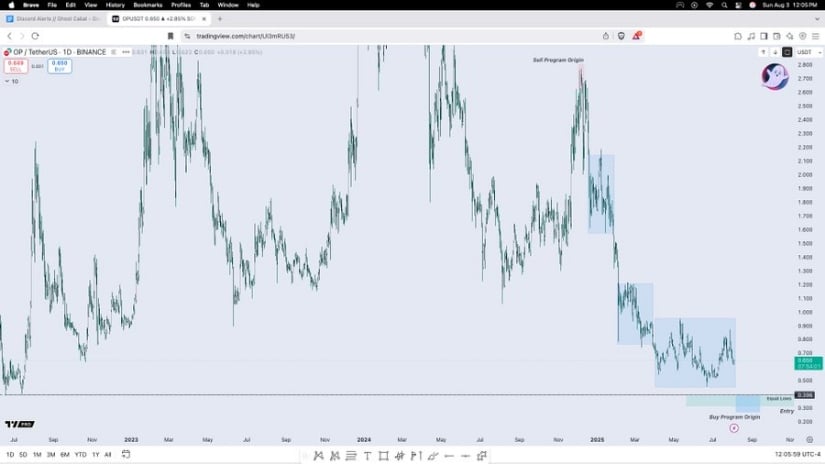
Optimism Price Structure Hints at Reversal NEAR $0.66The daily OP/USDT chart from X illustrates a clearly defined downtrend from late Q2 2025. OP fell sharply from above $3 to the sub-$0.70 range, forming a series of descending distribution zones.
These zones suggest systematic selling pressure, where each rally attempt was met with renewed resistance. The current consolidation range is marked around $0.65–$0.70, identified as a possible accumulation phase.
Source: X
Technical analyst @GhostMMXM referred to this zone as the “final stage in an MMXM” (Market Maker eXit Model), warning that failure to reclaim the $0.66–$0.70 level could result in a deeper breakdown.
According to the MMXM framework, this stage represents the last opportunity for a reversal before liquidity dries up entirely. The chart also highlights a final defensive region, slightly above $0.55, which could become the next test if the current support level fails.
The importance of reclaiming the lower consolidation band cannot be overstated. Without a decisive break above $0.70, the broader structure remains vulnerable to continued distribution and possible price capitulation into Q4.
Volume and Price Action Show Buyer Interest
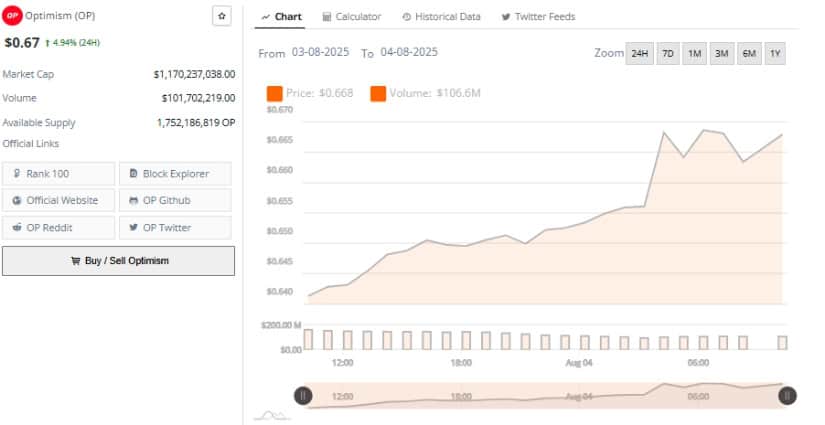
On August 4, OP posted a 4.94% gain, rising from an intraday low of $0.645 to a high of $0.668. The price action displayed a series of higher lows and higher highs, suggesting consistent buy-side activity. This upward movement occurred alongside a 24-hour trading volume of $106.6 million, indicating organic interest rather than a short-lived spike.
Source: BraveNewCoin
The chart reflects a slow but steady accumulation pattern, supported by rising volume during late sessions on August 3 into early August 4. Unlike previous rallies, this MOVE held its gains and did not fade, a positive signal for short-term structure. Should this trend continue, OP could challenge the resistance range of $0.70–$0.72, which was last tested in late July.
OP’s market capitalization sits at $1.17 billion, with 1.75 billion tokens in circulation. These figures support liquidity and trading activity levels necessary to maintain such momentum, assuming sentiment remains stable.
OP Holds $0.66 Support as Momentum Builds
At the time of writing, Optimism was priced at $0.669, having gained 1.98% during the day. The RSI stands at 47.93, marginally below the RSI-based moving average of 53.46. This places OP in neutral territory, with momentum leaning slightly toward oversold conditions. The RSI trend has been descending since mid-July, although the recent upward flicker may suggest renewed demand.

Source: TradingView
The 24-hour volume data also supports this tentative rebound. OP’s volume reached $106.6 million as of August 4, 2025, up from $101.7 million earlier in the day. This steady rise, coupled with higher lows in price, hints at accumulating interest rather than speculation. Daily market cap hovered around $1.17 billion, with a circulating supply of 1.75 billion tokens, keeping OP within the top 100 assets.
For bulls to sustain this reversal attempt, price action must hold above $0.66 and push beyond $0.70 in the coming sessions. A sustained move above this threshold, supported by rising volume and an RSI crossing 55, could set up a retest of the $0.72 resistance level observed in late July. However, a breakdown below $0.64 could reignite the prior bearish wave and retest the $0.55 entry zone noted by chart analysts.
