Hedera Primed for Explosive Rally as Elliott Wave Pattern Hints at Imminent Wave 3 Surge

Hedera's price chart is flashing a textbook bullish signal—and traders are scrambling to front-run the next leg up.
The setup: The Elliott Wave Theory—that old Wall Street divining rod—suggests HBAR is coiled for a Wave 3 breakout. For the uninitiated: Wave 3s are where the real money gets made (and where latecomers FOMO in at 2x the entry).
Why it matters: Institutional wallets have been quietly accumulating since Q2. Meanwhile, retail traders remain distracted by meme coin casinos—classic.
Bottom line: When a chart this clean aligns with on-chain accumulation, you either pay attention or wind up buying the top. Just ask the guys who dismissed Bitcoin at $900.

Crypto analysts have outlined bullish setups, indicating that HBAR could be entering wave 3 of a 5-wave bullish cycle with price targets ranging from $0.31 to $0.397.
The HBAR price action is unfolding against a backdrop of strong volume and clear demand between $0.258 and $0.288. Technical indicators, including RSI and stochastic readings, suggest the asset may be forming a base for a sharp upward move if support levels hold.
Hedera Price Eyes Breakout as Elliott Wave Setup Signals Wave 3
Hedera (HBAR) may be preparing for a new upward cycle as technical charts suggest the asset is forming wave 3 of an Elliott Wave structure. The recent pullback to the $0.2533 level has caught the attention of technical analysts who anticipate renewed momentum in the short term. The outlook positions HBAR price for a recovery if it continues to hold key Fibonacci levels and demand zones.
Analysts have identified strong support and volume interest in the $0.25 to $0.26 region, pointing to potential price stability before the next leg higher. With both price structure and oscillator indicators nearing pivot zones, traders are closely monitoring a sustained move back toward resistance levels NEAR $0.30 and $0.35.
Wave Structure Points Toward $0.3512 Target
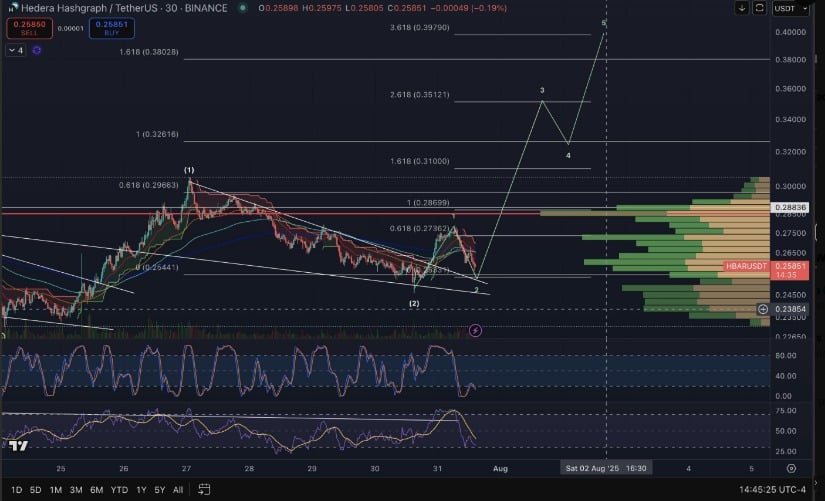
Crypto market analyst BigMike7335 published a chart suggesting HBAR is entering wave 3 of a 5-wave Elliott structure. According to the analysis, the token rebounded from $0.2533 after breaking out of a falling wedge, where the price intersected with key Fibonacci retracement levels. The chart places the next wave 3 target at $0.3512, with wave 5 projections extending as high as $0.3979.
Source:X
The analyst notes that HBAR previously reclaimed the 0.618 Fibonacci level of the recent correction at $0.2736 before revisiting the breakout zone. If the current structure holds, this retest could mark the end of wave 2 and the beginning of wave 3.
Indicators such as the Relative Strength Index (RSI) and stochastic oscillators are approaching levels associated with previous reversals, suggesting technical momentum could support an upward move.
Accumulation Zone Holds Amid Dip Buying Sentiment
According to WSB Trader Rocko, the recent price decline in HBAR has presented a potential accumulation opportunity. His analysis outlines a bounce formation near the $0.25 level, implying the start of a rounded recovery pattern. The chart proposes a scenario where HBAR begins building a base for renewed upside, supported by a cup-shaped structure forming in lower timeframes.

Source:X
Historical price action supports this view, with previous consolidations near similar price zones leading to upward moves. If momentum builds, the next resistance targets lie around $0.288 and $0.34.
While the $0.25–$0.26 zone remains key for support, traders are watching for any shift in volume or price structure that could confirm a trend change. If buyers regain control, this could push HBAR toward its earlier cycle highs.
HBAR Price and Volume Data Show Stabilization Attempts
Hedera (HBAR) fell 5.24% in the past 24 hours, currently trading around $0.25. The price dropped from above $0.27 to intraday lows below $0.245 before a modest rebound began forming late in the session. This intraday reversal near the lower support band indicates a possible short-term base.
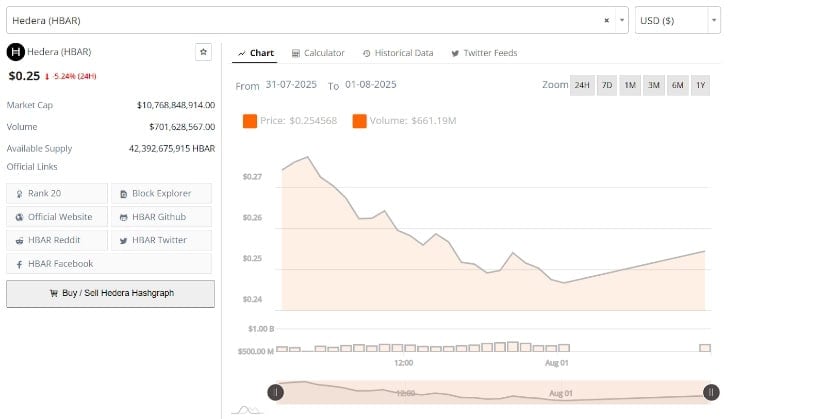
Source: BraveNewCoin
Trading volume remained stable throughout the decline, with 24-hour activity registering $661.19 million. This suggests investor interest is steady even amid price weakness. At the time of writing, the price is attempting a MOVE back above $0.255. Whether it maintains this recovery or meets resistance near $0.273 will help determine the next directional move, especially as sentiment across altcoins remains cautious.
