SEI Price Prediction: Bullish Momentum Breaks Long-Term Downtrend—Is This the Start of a Rally?

SEI shakes off bearish fatigue as buyers step in—could this be the reversal traders waited for?
After months of grinding lower, the token slashes through resistance with a momentum surge that's got the crypto crowd buzzing. No fancy indicators needed—the chart tells the story: higher lows, aggressive volume, and a clear break of the descending trendline.
Why now? Market whispers point to ecosystem growth and a shift in trader positioning. Meanwhile, Bitcoin’s stability gives altcoins room to run—classic ‘risk-on’ behavior. (Though let’s be real: half these moves are whales playing musical chairs with retail money.)
What’s next? If SEI holds this level, the next target is the January high. Fail? Back to the downtrend’s embrace. Either way—buckle up.

Trading activity has increased as SEI tests $0.34, suggesting growing conviction among bulls. This price juncture may determine the direction of SEI’s next significant move.
SEI Tests Macro Resistance Near $0.34
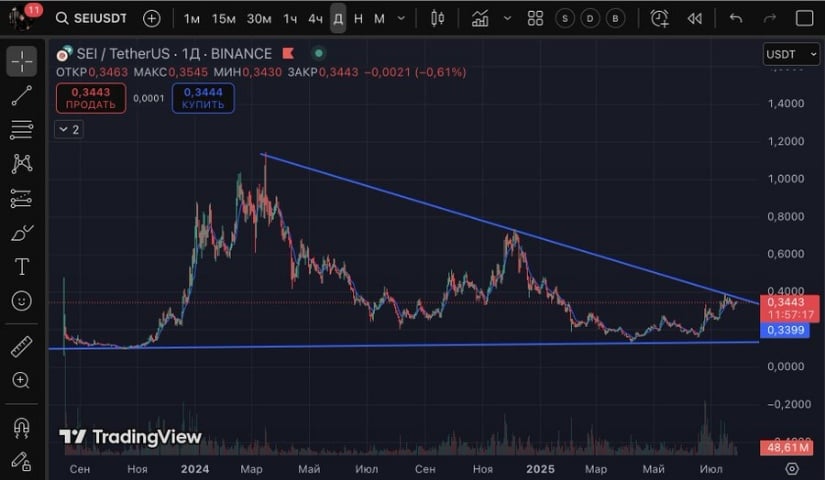
A chart posted by analyst Tiko (@tikooww) highlights SEI’s recent interaction with a descending trendline that extends from its all-time high. This line has historically rejected all prior attempts at upward momentum, defining a clear long-term downtrend.
However, Sei has now reached the resistance at $0.34 with stronger buying pressure, showing signs of structural change. The price has remained stable around this point, rather than being pushed downward, indicating a potential break of bearish control.
Source: X
Horizontal support NEAR $0.33 has also played a consistent role in SEI’s price structure. This zone has been tested repeatedly over the past year, offering a base for buyers to re-enter. The confluence of horizontal support and descending resistance creates a classic breakout structure.
A daily close above the downtrend line WOULD confirm a structural flip and may open the door for a rapid move toward the $0.50–$0.60 region. This target zone coincides with earlier consolidation levels and high-volume trading ranges.
24-Hour Chart Reflects Increased Selling Pressure
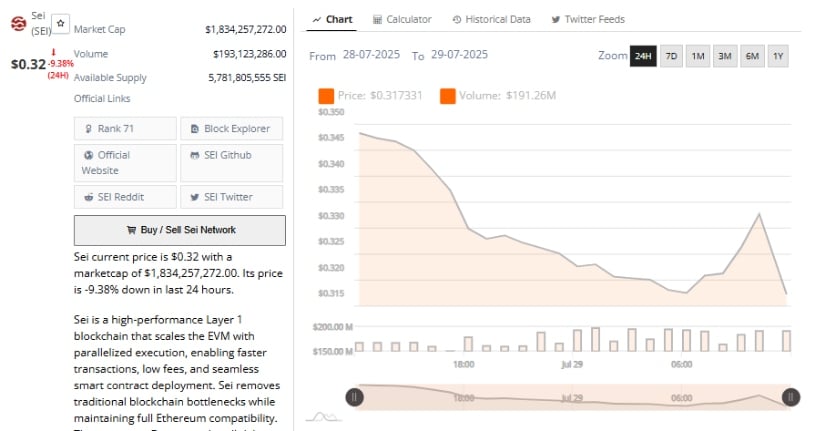
The price chart from July 28 to July 29, 2025, indicates a significant intraday decline. SEI opened above $0.34 and trended lower for most of the session, reaching an intraday low near $0.317.
The largest drop occurred during the overnight hours, contributing to a 9.38% price decrease in a 24-hour window. This sharp correction signals temporary selling dominance and short-term risk sentiment changes.
Source: BraveNewCoin
Despite the price decline, trading volume peaked at $193 million, showing that the sell-off was driven by heightened participation. The consistent volume throughout the session suggests active distribution, possibly from short-term holders capitalizing on earlier gains.
Toward the end of the timeframe, SEI showed a modest recovery to around $0.32. However, the rebound lacked strength and failed to break through resistance. Unless the price reclaims $0.33 soon, market sentiment may remain cautious. The $0.30 level now stands as an important psychological support.
At the Time of Writing: Mixed Signals from CMF and BBP Indicators
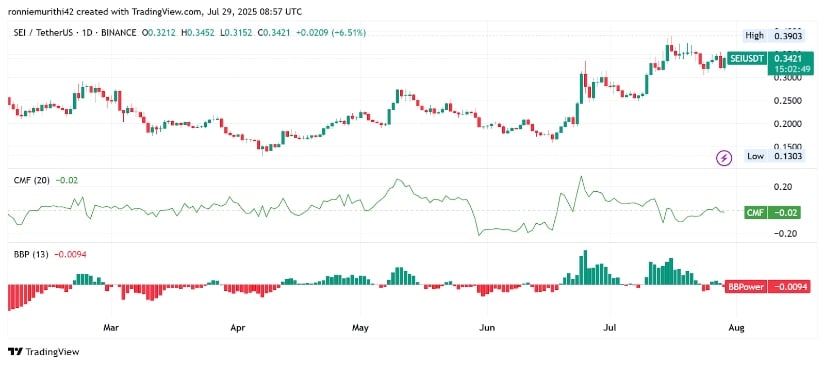
At the time of writing, SEI trades at approximately $0.34 following a 5.88% daily gain. Two key indicators, the Chaikin Money FLOW (CMF) and Bull and Bear Power (BBP), present contrasting signals.
The CMF currently sits at -0.02, indicating mild distribution as capital outflows slightly outweigh inflows. This suggests some caution among market participants, despite the recent price recovery.
Source: TradingView
Meanwhile, the BBP indicator is near neutral at -0.0089. This implies that neither buyers nor sellers are in full control. Over the past month, BBP has shown several bullish waves, most recently during July’s rally.
However, momentum appears to be fading slightly as SEI faces critical resistance. Traders will monitor whether a positive crossover in these indicators occurs in the coming sessions, which could confirm a renewed bullish phase. Until then, price stability above the downtrend line remains essential to validate the breakout thesis.
