Worldcoin Primed for Bullish Reversal: $1.20 Breakout Could Ignite Rally

Worldcoin's price action screams momentum shift—traders are piling in as the token flirts with a critical resistance level.
Bulls vs. Bears: Who Blinks First?
The $1.20 threshold isn't just psychological—it's the line in the sand separating 'promising rebound' from 'full-blown trend reversal.' Technicals suggest accumulation, but as always in crypto, the market loves humbling overeager traders (especially those who YOLO'd their rent money).
Breakout or Fakeout?
Watch the order books. A clean close above $1.20 with volume could trigger algorithmic buying, while rejection here might see panic sellers dive for the exits. Either way—grab popcorn. The only certainty in this market? Someone's about to tweet 'I told you so.'

A combination of trendline resistance, volume stabilization, and indicator divergence now positions the asset NEAR a critical inflection point. Traders are closely monitoring price action around $1.20, a key resistance level that could signal renewed bullish momentum if breached.
Resistance Pressure Builds as Price Nears Trendline
The 3-day chart of WLD/USDT, shared by analyst Baykuş (@BaykusCharts), presents a descending trendline that has rejected multiple rally attempts since the asset’s all-time high. The chart indicates a pattern of lower highs, with Worldcoin currently trading near $1.179 and once again testing this long-term resistance.
The proximity to this descending yellow trendline places WLD in a high-stakes position where breakout or rejection could define the next major move.

Source: X
A horizontal support zone around $0.95–$1.00 has consistently held over several months, forming a base for recent accumulation. The short- to mid-term exponential moving average ribbon has begun to act as support instead of resistance.
Candlesticks are pressing against this ribbon, reinforcing the pressure build-up along the descending trendline. A decisive MOVE above this confluence could signal the start of a medium-term bullish trend, especially if volume expands during the breakout.
24-Hour Pullback Triggers Temporary StabilizationThe short-term chart from July 28 to July 29 shows WLD opening around $1.20 before declining steadily to approximately $1.10 by midnight. The intraday loss of 8.94% highlights dominant bearish sentiment, likely driven by profit-taking.
Daily trading volume surpassed $287 million, confirming high market participation despite the drop. The decline also brought the market cap to just over $2 billion.
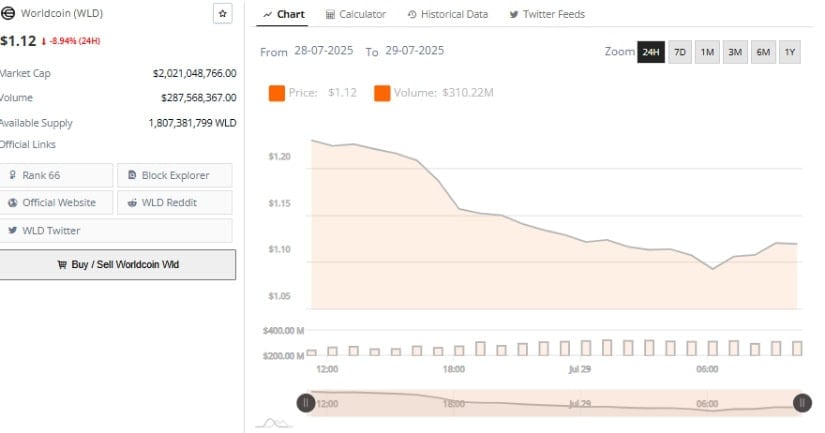
Source: BraveNewCoin
After the sharp sell-off, the price stabilized between $1.08 and $1.10, forming a sideways trading range. This zone may act as a support base if buying pressure resumes. The recovery near the end of the 24-hour window was modest, lifting the price to $1.12, but it failed to challenge the earlier high.
The continued caution suggests that buyers have not yet regained control, and WLD may require stronger bullish catalysts to reclaim higher levels.
At the Time of Writing, Indicators Reflect a Mixed Sentiment Shift
The daily chart of WLD/USDT on TradingView reveals a soft rebound from recent lows near $1.08. The price is trading at $1.128 at the time of writing. Earlier gains in July brought the token close to $1.50 before sellers began exerting pressure near resistance zones.
The current pullback appears contained, but continued pressure below $1.20 could delay breakout momentum.
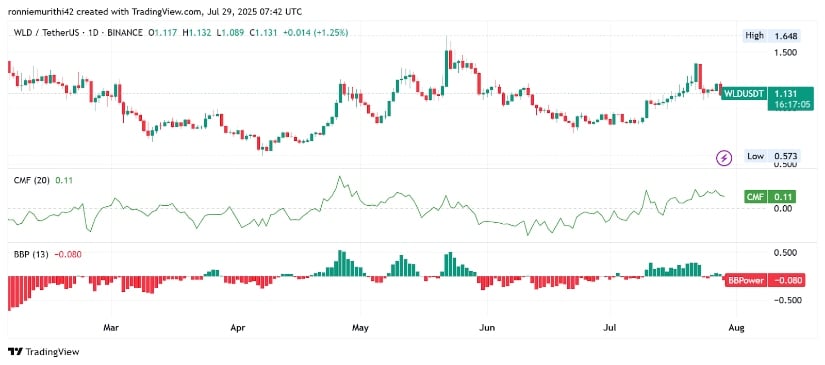
Source: TradingView
The Chaikin Money FLOW (CMF) is holding at +0.10, indicating sustained inflows. This supports the argument for continued accumulation and underlying investor interest. However, the Bull and Bear Power (BBP) indicator prints -0.081, showing short-term bearish strength.
The divergence between CMF and BBP signals a potential shift in trend, with bulls still defending support, but short-term bears preventing breakout confirmation.
