Optimism (OP) Price Prediction: Bulls Retreat as Bears Fortify the $0.71 Battlefront

OP's rally hits a wall—traders face off at the $0.71 resistance like crypto gladiators.
Subheader: The $0.71 Standoff
Optimism's surge stalls as bears dig trenches at the $0.71 price zone. The Layer 2 token's 30-day rally—once a beacon for degens—now faces its first real test. Market depth charts show sell orders piling up faster than unverified Twitter alpha.
Subheader: Technicals Turn Tense
RSI flirts with overbought territory while funding rates hover near neutral. Neither bulls nor bears hold clear leverage—a classic crypto stalemate. 'This isn't FUD, just math,' quips one perpetually exhausted analyst.
Closing volley: If OP breaks $0.71, the next stop could be DeFi summer nostalgia levels. If not? Another entry for the '2025 Crypto Rollercoaster' highlight reel—right between the SEC's latest tantrum and that memecoin that rugged despite '100x assured' promises.

Since then, the price has gradually declined, signaling a possible shift in short-term sentiment. At the time of writing, OP is trading at $0.647, while the market evaluates whether this pullback is a temporary pause or a deeper correction.
OP Price Structure Shows Signs of Weakening Momentum
The 1-hour chart for OP/USDT highlights a rapid ascent that peaked NEAR $0.71 before retracing into a consolidation phase. This shift was marked by a pattern of lower highs and sustained rejection above the $0.68 zone.
The token’s inability to retest prior highs has created a visible descending structure, with support gradually forming near $0.62. These lower highs paired with modest rebounds indicate a cooling phase in buyer strength, as resistance remains firmly defended.
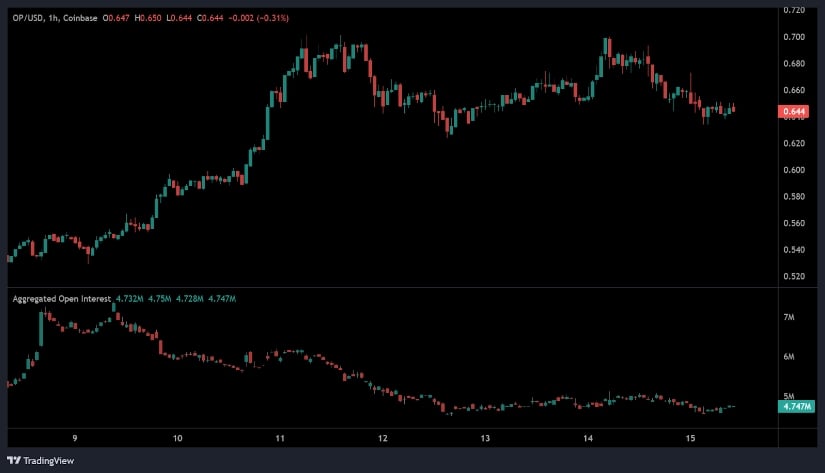
Source: Open Interest
Candlestick patterns within this consolidation phase show several long upper wicks and small-bodied formations, often associated with distribution or hesitation among bulls. The lack of follow-through on rebound attempts suggests that momentum has diminished.
Meanwhile, the open interest data reveals a drop from 6.5 million to 4.73 million, confirming a reduction in Leveraged positions. This decline implies traders have either taken profits or exited due to the heightened volatility, further reinforcing the subdued state of the current market.
Persistent Volume Amid Pullback Reflects Cautious Trading
Additionally, the 24-hour price movement underscores a 4.37% decline, falling from $0.6801 on July 14 to $0.647 on July 15. The downtrend unfolded steadily, with consistent sell-side activity limiting any meaningful recoveries.
OP’s trading volume during this period remained elevated, with figures ranging between $279 million and $300.19 million, despite the price decrease. This suggests that sellers maintained control, using volume to absorb buyer pressure at higher levels.
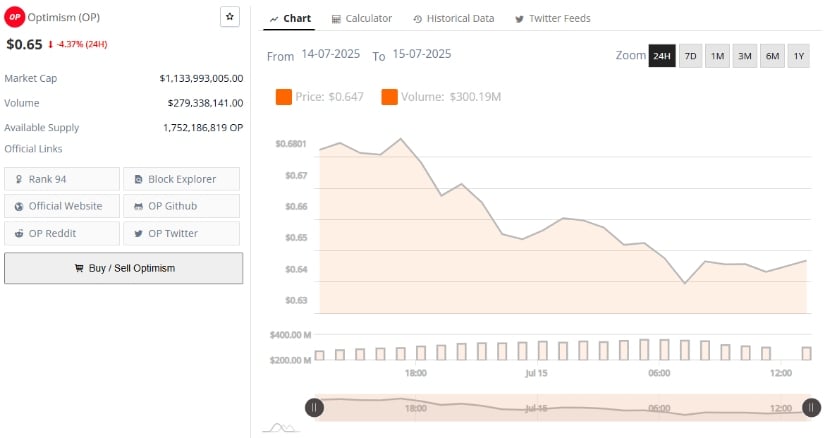
Source: BraveNewCoin
As of the latest market update, OP holds a market capitalization of $1.13 billion, supported by a circulating supply of more than 1.75 billion tokens. The asset is currently ranked #94 globally, reflecting moderate investor interest.
While a bounce from the $0.63–$0.65 zone is possible, failure to establish support in this area could prompt further losses. For now, the flat behavior in trading activity suggests a wait-and-see approach as market participants assess upcoming movements in broader market trends.
Technical Indicators Reflect a Cautious Rebound Attempt
On the other hand, the daily chart shows OP forming a gradual recovery following its previous decline to $0.457, with price action generating a sequence of higher lows. This pattern indicates a potential bottoming structure, although the token continues to face resistance during upward moves. At the time of writing, OP trades at $0.647, attempting to maintain recent gains but showing signs of weakening bullish conviction due to repeated rejection wicks at higher levels.
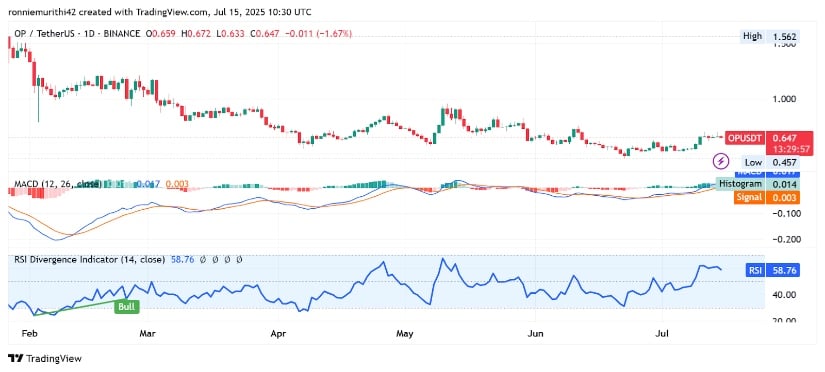
Source: TradingView
The MACD indicator signals a mild bullish shift, with the MACD line crossing above the signal line and the histogram turning positive. However, the crossover remains narrow, and momentum remains tentative. Similarly, the RSI prints 58.76, signaling moderate strength without entering overbought territory.
While these indicators suggest the possibility of a breakout, they also highlight that further confirmation—through increased volume and upward price expansion—is required. A failure to reclaim the $0.68 zone could lead to a retest of support near $0.60–$0.62, a critical area for the token’s near-term trajectory.
