Hedera HBAR Smashes Resistance: $0.42 Target in Sight as Volume Explodes

Hedera's native token HBAR isn't asking for permission—it's taking names. A blistering breakout backed by surging volume has traders whispering about a run toward $0.42. The kind of move that makes traditional finance bros clutch their spreadsheets.
Technical breakout or sustainable rally? HBAR's chart tells the story. The token sliced through resistance like a hot knife through butter, with trading volume spiking harder than a Wall Street intern's adrenaline during earnings season. This isn't just noise—it's the market voting with its wallet.
While the suits debate 'blockchain adoption,' HBAR's price action does the talking. One thing's clear: when volume talks, smart traders listen. Whether this holds or becomes another crypto 'to the moon' meme remains to be seen—but for now, the bulls are in charge.

Hedera Price has captured renewed attention following a confirmed breakout, with bullish analysts projecting extended upside toward the $0.30 to $0.42 range.
Analysts suggest the breakout marks a structural trend shift, with $0.28 and $0.42 as the next key levels to watch. As HBAR price tests resistance zones, traders are closely monitoring consolidation behavior and volume to confirm whether a sustained move higher is forming.
Hedera HBAR Price Eyes $0.42 After Breakout
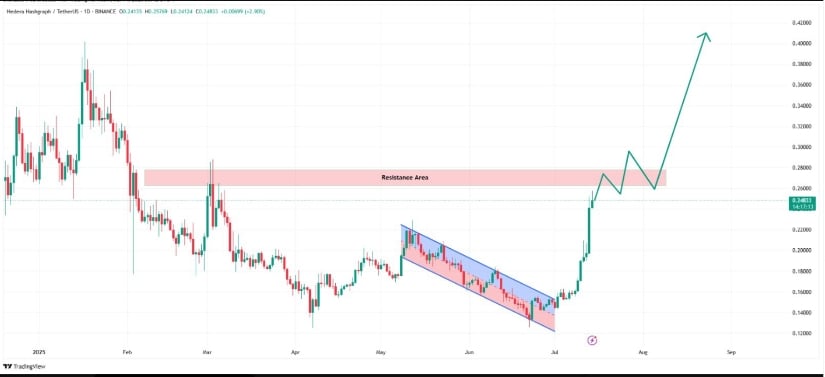
Hedera (HBAR) Price has moved decisively above a descending parallel channel on the daily chart, as shared by analyst Token Talk. The breakout came after weeks of price compression between early June and July, with the token reversing from lows near $0.16 and now trading at approximately $0.24833. The Hedera Price trajectory has been steep, supported by strong daily momentum and consistent follow-through.
Source :X
A resistance zone between $0.26 and $0.28 now stands as the next technical barrier. If the token sustains above the former channel resistance, the path may open toward the $0.42 level as projected in the analyst’s chart.
Thus, the outlined structure suggests a potential continuation pattern, where consolidation NEAR resistance could precede another leg up. Hence, the current price remains near critical resistance, with short-term consolidation likely to determine the next phase.
HBAR Weekly Structure Confirms Trend Shift
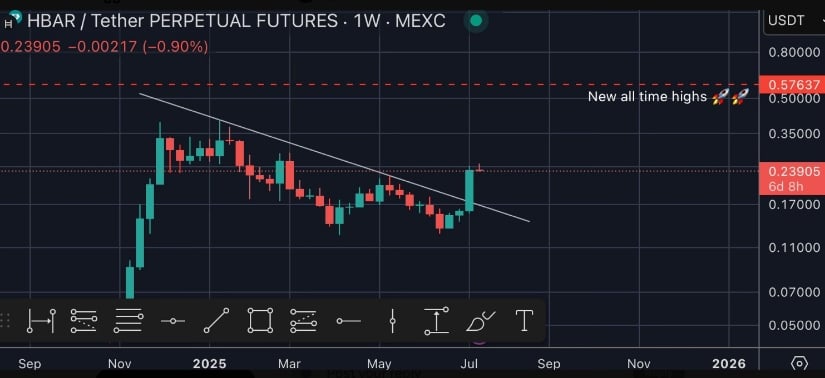
Analyst WSB Trader Rocko confirmed a breakout above a multi-month descending trendline on HBAR’s weekly chart. Therefore, the recent weekly candle closed above the trendline, signaling a structural reversal after a prolonged period of sideways trading. According to the analysis, the token reached $0.239 during the breakout, with early July activity showing increased buyer interest.
Source:X
The long-term chart positions $0.576 as the level for a potential new all-time high. Rocko also noted ecosystem developments such as DeFi expansion, the integration of USDC, and the tokenization of real-world assets on Hedera as drivers of increased investor attention. These elements contribute to sustained sentiment around the asset as technical levels break and previous resistance zones turn into support.
Crypto Patel’s Analysis Supports Rally Toward $0.42 Zone
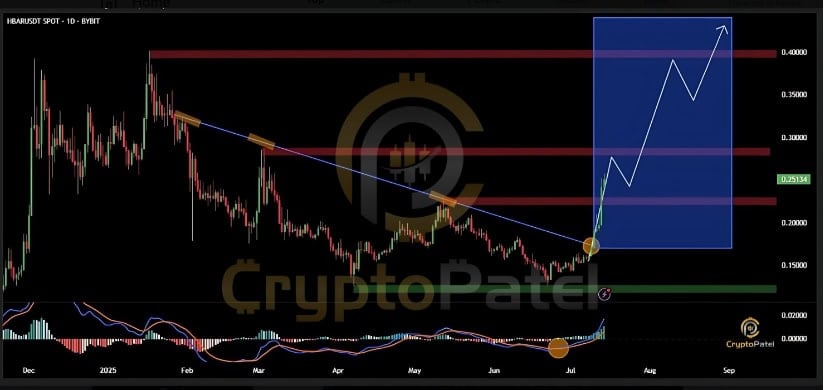
Crypto Patel added to the bullish outlook by identifying a confirmed breakout from a descending trendline supported by multiple technical indicators. Patel pointed out a MACD crossover and a strong support base above the $0.10 area. These signals, combined with rising interest, have contributed to the shift in trend structure and sentiment. Patel noted that the breakout appears “real,” suggesting growing market confidence in the move.
Source:X
The chart shared in the commentary outlines short-term resistance zones on the path to a broader range between $0.30 and $0.42. Patel recommended waiting for a potential retest of the broken trendline before entering new positions, a strategy aligned with traditional technical setups. If the retest holds, the rally could continue in line with the projection shown in the target zone.
Short-Term Price Correction and Support Retest Observed
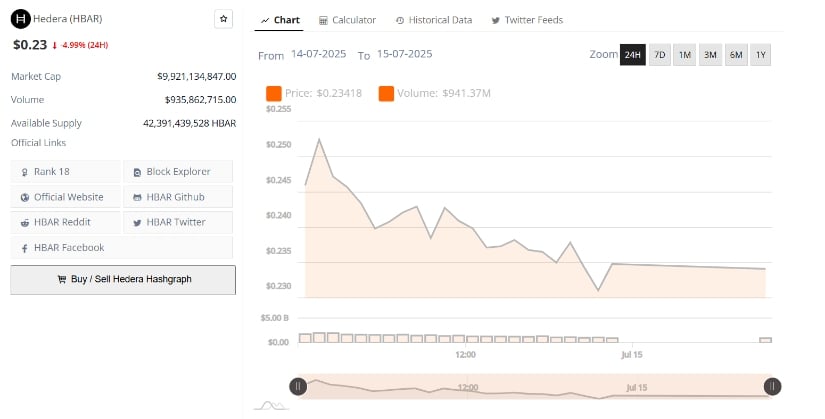
In the last 24 hours, HBAR Price experienced a 4.99% decline, falling from a session high above $0.25 to stabilize near $0.234. Therefore, the downward move followed a sharp rally earlier in the week and marks a temporary correction after overextension. Hedera price action showed a failure to hold the $0.240 support, although the decline found stability above $0.230.
Source:BraveNewCoin
Despite the drop, trading volume stayed elevated at over $935 million, indicating sustained interest. With the recent consolidation, it could provide the foundation for another upward MOVE if buyers continue accumulating near current levels. Analysts are watching the $0.23 zone as a short-term support level, with renewed upward pressure expected if price can remain above it.
