SEI Defies Volatility: Holding Firm at $0.33 as Market Cap Proves Resilience

SEI isn't blinking. While the crypto market gyrates like a meme-stock trader on espresso, the token clings to $0.33—a price floor tougher than a banker's handshake.
Market Cap Muscle
Behind the stalemate? A market cap that refuses to buckle. No flashy pumps, no panic dumps—just stubborn equilibrium. Traders whisper about accumulation, but let's be real: everyone's just waiting for the next leveraged long to blow up.
Volatility's Identity Crisis
SEI's price chart has gone from rollercoaster to metronome. Whether that's institutional interest or sheer boredom depends on who's holding the bag. (Spoiler: it's probably the degens.)
Final Thought
In a sector where 'stable' usually precedes 'coin,' SEI's flatline is either a masterclass in consolidation... or the calm before the hedge funds pounce. Place your bets—just don't mortgage your NFT portfolio.

A sharp 18% rally helped the token break above multiple technical barriers, attracting attention from short-term traders. As volume and volatility metrics align with bullish continuation, SEI now trades NEAR $0.3324. Market watchers are focused on whether this move holds or fades below support.
Breakout Above Descending Resistance Highlights Renewed Momentum
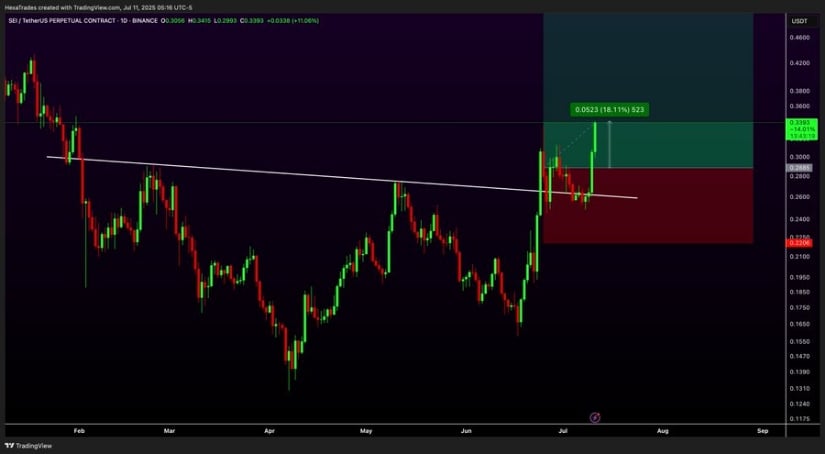
The daily SEI/USDT chart shared by analyst HexaTrades confirms a breakout above a descending trendline that capped price action since March. This long-term trendline had previously rejected multiple bullish attempts, maintaining pressure on SEI through Q2 2025.
The recent price surge, which carried Sei from $0.29 to $0.3399 within a single session, marked the first confirmed breakout in months and could reflect a broader shift in market behavior.
Source: X
The green target zone plotted on the chart extends up to $0.42, suggesting room for continuation if buyers maintain momentum. A risk zone just below $0.28 marks invalidation, giving this setup a favorable structure for directional trades.
The clean breakout pattern may invite additional bids if SEI revisits the $0.29–$0.30 zone and holds, reinforcing the current trend structure. With higher lows continuing to FORM since late June, SEI appears to be entering a short-term upward phase.
Intraday Volatility and Volume Data Paint Mixed Picture
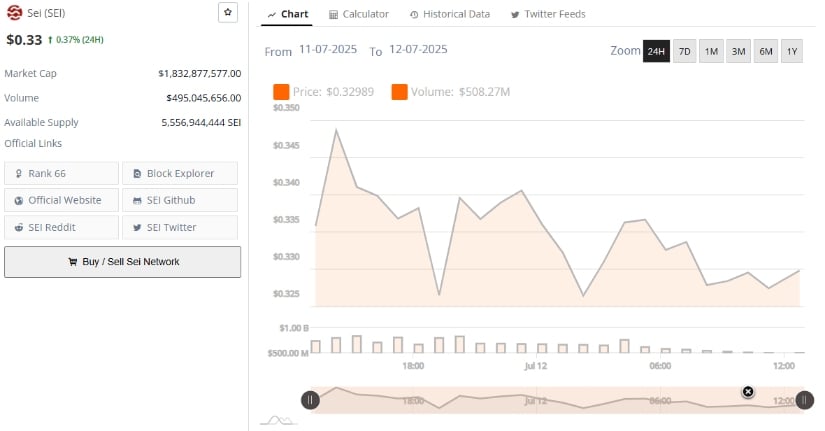
Additionally, data from BraveNewCoin between July 11 and July 12 shows SEI reaching a session high of $0.347 before retracing to a low near $0.325. Despite opening around $0.33, the token failed to sustain highs, reflecting mixed intraday sentiment. Price action during this 24-hour window shows multiple rejections near the $0.345–$0.350 zone, which now acts as a short-term resistance.
Source: BraveNewCoin
Total trading volume during the period hit $508.27 million, slightly higher than the previous day. However, volume levels tapered off into the close, indicating some momentum fatigue. The price remains range-bound for now, with support seen near $0.325 and resistance at $0.350.
Market cap stands at $1.83 billion, ranking SEI as the 66th largest crypto asset. A decisive move above $0.350 with increased volume may be needed to confirm any sustained breakout beyond the current range.
Technical Indicators Suggest Room for Upside Extension
On the other hand, according to TradingView data, the SEI/USDT daily chart shows bullish continuation supported by the Awesome Oscillator (AO), which has flipped positive. The histogram is expanding, indicating momentum buildup following a prolonged period of contraction in June.
With the price structure now printing higher highs and higher lows, the breakout pattern aligns with bullish trend reversal criteria.

Source: TradingView
The Crypto Volatility Index (CVI) for SEI has also risen steadily, currently at 196.24B. This uptick in volatility and capital movement may reflect renewed attention from both retail and institutional participants.
If price clears the $0.3446 resistance and sustains above $0.33, SEI could retest the $0.38–$0.43 range. Should momentum weaken, the key support level to monitor will be near $0.30, where a retest could either confirm strength or trigger a deeper pullback.
